
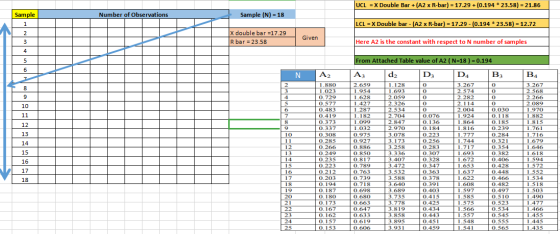
can u clearly show me how to find a sample size (N) , A2, and can you also tell me why we are using an X Chart?
Homework Answers
For measuring continuous data like weight,size,any other measurement which need to be continuous monitored to address the performance of the manufacturing process and thus to reduce the variability and defect in the manufacturing system.
solution as attached Below
UCL and LCL are the Upper and lower limits were the X double bar is the mean of all the observations.
Add Answer to:
can u clearly show me how to find a sample size (N) , A2, and
can...
1. The fuel economy information on a new SUV window sticker indicates that its new owner...
1. The fuel economy information on a new SUV window sticker indicates that its new owner can expect 16 mpg (miles per gallon) in city driving and 20 mpg for highway driving and 18 mpg overall. Accurate gasoline records for one such vehicle were kept, and a random sample of mileage per tank of gasoline was collected. 19.0 16.6 19.9 22.8 18.7 18.2 18.0 15.4 19.1 20.5 16.9 20.4 21.6 18.6 20.8 16.5 16.9 16.9 17.9 16.9 19.9 16.1 17.6...
The fuel economy sticker on a new SUV’s window sticker indicates the owner can expect 16...
The fuel economy sticker on a new SUV’s window sticker indicates the owner can expect 16 mpg in city driving and 20 mpg highway driving and 18 mpg overall. Accurate gasoline records for one such vehicle were kept, and a random sample of mileage per tank of gasoline was collected: 17.6 17.7 18.1 22.0 17.0 19.4 18.9 17.4 21.0 19.2 18.3 19.1 20.7 16.7 19.4 18.2 18.4 17.1 17.4 15.8 17.9 18.0 16.3 17.5 17.3 20.4 19.1 21.0 18.1 19.0...
Using the data file provided with both variables, x and y, answer the following questions using...
Using the data file provided with both variables, x and y, answer the following questions using Excel*: 1.Create a scatterplot with the data. Comment on direction, form, strength, outliers and/or other significant findings. 2.Use the linear model to fit a line to the data and determine the equation ỹ = b0 + b1x and Interpret b0and b1. 3.Calculate the coefficient of correlation. Discuss the strength of correlation between the explanatory and response variables. 4.Predict the value for ỹ when you...
7.Physical Characteristics of sharks are of interest to surfers and scuba divers as well as to...
7.Physical Characteristics of sharks are of interest to surfers and scuba divers as well as to marine researchers. Because it is difficult to measure jaw width in living sharks, researchers would like to determine whether it is possible to estimate jaw width from body length, which is more easily measured. The following data on x = length (in feet) and y = jaw width (in inches) for 44 sharks was found in various articles appearing in the magazines Skin Diver...
Favorable weather has been shown to be associated with increased tipping. Will just the belief that...
Favorable weather has been shown to be associated with increased tipping. Will just the belief that future weather will be favorable lead to higher tips? The researchers gave 60 index cards to a waitress at an Italian restaurant in New Jersey. Before delivering the bill to each customer, the waitress randomly selected a card and wrote on the bill the same message that was printed on the index card. Twenty of the cards had the message "The weather is supposed...
We are interested in the relationship between the compensation of Chief Executive Officers (CEO) ...
We are interested in the relationship between the compensation of Chief Executive Officers (CEO) of firms and the return on equity of their respective firm, using the dataset below. The variable salary shows the annual salary of a CEO in thousands of dollars, so that y = 150 indicates a salary of $150,000. Similarly, the variable ROE represents the average return on equity (ROE)for the CEO’s firm for the previous three years. A ROE of 20 indicates an average return...
A gardener plants 300 sunflower seeds (of a brand called KwikGrow) and, after 2 weeks, measures...
A gardener plants 300 sunflower seeds (of a brand called KwikGrow) and, after 2 weeks, measures the seedlings’ heights (in mm). These heights are recorded below. He is interested in testing whether the mean height of sunflowers grown from KwikGrow seeds is greater than 33 mm two weeks after planting. He decides to conduct a hypothesis test by assuming that the sampling distribution of the sample mean has a normal distribution. For the purposes of this question, you may assume...
I need help with my applied managerial statistics project Do a descriptive analysis(calculate mean, mode ,range...
 I need help with my applied managerial statistics project
Do a descriptive analysis(calculate mean, mode ,range ,variance
,std ,deviation etc ) on each of the four variables sales ,calls, time,
years and plot a histogram (using Excel)for each of the four
variables.
B Sales (Y) 37 38 40 117 45 43 34 37 137 138 44 45 37 38 43 46 45 Calls (X1) Time (X2) Years (X3) 117 14.8 117 15.3 15.6 117 15.8 120 18.2 120 13.6 131...
I need help with my applied managerial statistics project
Do a descriptive analysis(calculate mean, mode ,range ,variance
,std ,deviation etc ) on each of the four variables sales ,calls, time,
years and plot a histogram (using Excel)for each of the four
variables.
B Sales (Y) 37 38 40 117 45 43 34 37 137 138 44 45 37 38 43 46 45 Calls (X1) Time (X2) Years (X3) 117 14.8 117 15.3 15.6 117 15.8 120 18.2 120 13.6 131...
We consider the multiple linear regression with LIFE (y) as the response variable, and MALE, BIRT...
We consider the multiple linear regression with LIFE (y) as the response variable, and MALE, BIRTH, DIVO , BEDS, EDUC, and INCO, as predictors. QUESTION: Plot the standardized residuals against the fitted values. Are there any notable points. In particular look for points with large residuals or that may be influential. # please screenshot the Rcode for the plot. # data information are as follows: "STATE" "MALE" "BIRTH" "DIVO" "BEDS" "EDUC" "INCO" "LIFE" AK 119.1 24.8 5.6 603.3 14.1 4638...
 I need help with my applied managerial statistics project
Do a descriptive analysis(calculate mean, mode ,range ,variance
,std ,deviation etc ) on each of the four variables sales ,calls, time,
years and plot a histogram (using Excel)for each of the four
variables.
B Sales (Y) 37 38 40 117 45 43 34 37 137 138 44 45 37 38 43 46 45 Calls (X1) Time (X2) Years (X3) 117 14.8 117 15.3 15.6 117 15.8 120 18.2 120 13.6 131...
I need help with my applied managerial statistics project
Do a descriptive analysis(calculate mean, mode ,range ,variance
,std ,deviation etc ) on each of the four variables sales ,calls, time,
years and plot a histogram (using Excel)for each of the four
variables.
B Sales (Y) 37 38 40 117 45 43 34 37 137 138 44 45 37 38 43 46 45 Calls (X1) Time (X2) Years (X3) 117 14.8 117 15.3 15.6 117 15.8 120 18.2 120 13.6 131...
Most questions answered within 3 hours.
-
Why [M(CN)6] is not organometallic even it has metal
to carbon bond too
asked 52 seconds ago -
mstar electric has a bond issue outstanding that has a 20 year
life, a $1,000 par...
asked 8 minutes ago -
This is a Business Writing Question:
Common Types of Faulty Sentence Logic:
A. Mixed constructions
B....
asked 9 minutes ago -
Skinner asserts that science, and the common view of science, has
been tarnished. Explain his evidence...
asked 11 minutes ago -
Question 3 (1 point)
Fill in the blank. Speed Car Rental company found that the tire...
asked 12 minutes ago -
An short-seller in Tesla is worried the latest management
earnings forecast is too aggressive and the...
asked 12 minutes ago -
A grocery store's receipts show that Sunday customer purchases
have a skewed distribution with a mean...
asked 18 minutes ago -
A 0.035 mol sample of a weak acid, HA, is dissolved in 437 mL of
water...
asked 29 minutes ago -
a sample of Ar gas has a volume of 6.30 L with an unknown
pressure. the...
asked 30 minutes ago -
The
serum cholesterol levels of a population of kids follow a normal
distribution with mean 155...
asked 50 minutes ago -
han discusses the racist practice of badlands, a bar
in the Castro
district of San Francisco,...
asked 1 hour ago -
A sample of final exam scores is normally distributed with a
mean equal to 25 and...
asked 1 hour ago