


Homework Answers
Add Answer to:
Q4 (1 point). The figure below shows the marginal social benefit, marginal private cost and marginal...
thanks for help^^ Q7 (1 point) The figure below displays the demand curve for Jane's Auto...
 thanks for help^^
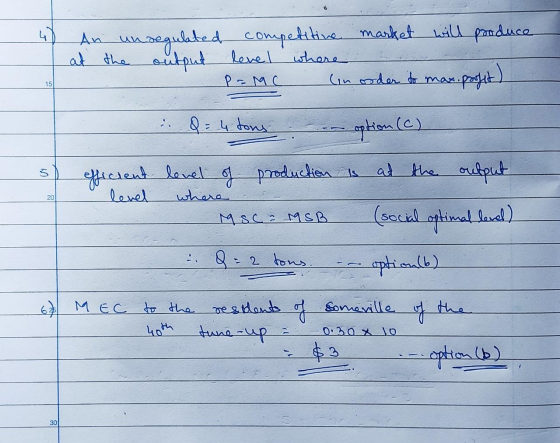
Q7 (1 point) The figure below displays the demand curve for Jane's Auto Tune-Ups in the town of Someville. The supply curve captures Jane's marginal cost. Suppose that each tune-up generates one quart of used motor oil. Currently after each tune-up, Jane dumps the quart of used motor oil in the local river. Each quart of oil dumped in the river imposes a cost of $0.30 on each resident that lives in Someville, due to the cost...
thanks for help^^
Q7 (1 point) The figure below displays the demand curve for Jane's Auto Tune-Ups in the town of Someville. The supply curve captures Jane's marginal cost. Suppose that each tune-up generates one quart of used motor oil. Currently after each tune-up, Jane dumps the quart of used motor oil in the local river. Each quart of oil dumped in the river imposes a cost of $0.30 on each resident that lives in Someville, due to the cost...
The accopmanying graph depicts the marginal social cost (MSC) and marginal social benefit (MSB) of pollution...
 The accopmanying graph depicts the marginal social cost (MSC) and marginal social benefit (MSB) of pollution emissions. 1,000 900 Move the point, P, to the point representing the optimal level of pollution. MSC 800 What is the optimal quantity of pollution? 700 Dollars metric tons 400 300 The optimal quantity of pollution is not zero because: 200 MSB O 0 1 2 3 4 5 6 Metric tons of pollution 7 8 9 10 O the marginal social cost of...
Marginal benefit Marginal social The table below shows information about the costs and benefits of a...
 Marginal benefit Marginal social The table below shows information about the costs and benefits of a steel smelter that pollutes the air of a city. The marginal external cost of this pollution is $10 per ton at every quantity of steel produced. Use this information to answer questions 33-35. Quantity of steel (millions of tons cost (dollars per per week) (dollars per ton) 5 40 20 10 35 25 15 30 30 20 25 35 25 20 40 - ton)...
Marginal Marginal private cost external cost social cost Marginal Quantity (tons of paper) (dollars) (dollars) (dollars)...
 Marginal Marginal private cost external cost social cost Marginal Quantity (tons of paper) (dollars) (dollars) (dollars) 100 10 5 200 20 10 300 30 15 400 40 20 500 50 25 1) The table above gives the private costs and external costs of producing paper. Complete the table by finding the marginal social cost at each level of production. b. If the market is al competitive and is left unregulated and 400 tons of paper are produced, what is the...
The graph shows the marginal costs of chemical production. Cost (dollars per ton) Draw an arrow to show the marginal external cost of producing the 3rd ton of chemicals in a week. cost is the cost of...
 The graph shows the marginal costs of chemical production. Cost (dollars per ton) Draw an arrow to show the marginal external cost of producing the 3rd ton of chemicals in a week. cost is the cost of producing an additional unit of a good O A. that falls on people other than the producer of the good O B. that is borne by the buyer of the good that falls on the entire society C, O D. that is borne...
Use Table Below: Coal Mine Pollution. The table shows the marginal social benefit and cost of...
 Use Table Below: Coal Mine Pollution. The table shows the
marginal social benefit and cost of various amounts of pollution
from a coal mine. If 5 tons of pollution is produced, the marginal
social benefit is _____, and the marginal social cost is
_____.
$400; $400
$300; $500
$0; $800
$800; $0
Table: Coal Mine Pollution Quantity of Marginal Marginal Pollution Social Social (tons) Benefit Cost $800 $0 700 100 600 200 500 300 400 500 200 600 700 0...
Use Table Below: Coal Mine Pollution. The table shows the
marginal social benefit and cost of various amounts of pollution
from a coal mine. If 5 tons of pollution is produced, the marginal
social benefit is _____, and the marginal social cost is
_____.
$400; $400
$300; $500
$0; $800
$800; $0
Table: Coal Mine Pollution Quantity of Marginal Marginal Pollution Social Social (tons) Benefit Cost $800 $0 700 100 600 200 500 300 400 500 200 600 700 0...
4. The effect of negative externalities on the optimal quantity of consumption Consider the market for...
 4. The effect of negative externalities on the optimal quantity of consumption Consider the market for paper. Suppose that a paper factory dumps toxic waste into a nearby river, creating a negative externality for those living downstream from the factory. Producing an additional ton of paper imposes a constant marginal external cost of $100 per ton. The following graph shows the demand curve and the private marginal cost (MC) curve for paper. (Note: The demand for the plant's paper is...
The graph shows the marginal private benefit from design school education. The marginal cost of this...
 The graph shows the marginal private benefit from design school education. The marginal cost of this education is a constant $12,000 a year. The marginal external benefit from a design school education is $4,000 per student per year. Suppose the government decides to provide public design schools. Price and cost (thousands of dollars) 28- Draw the marginal cost curve. Label it MC. Draw the marginal social benefit curve. Label it MSB. Draw a line that shows the tuition that schools...
Steel production from a mill generates a negative externality because of the environmental damage linked to...
Steel production from a mill generates a negative externality because of the environmental damage linked to air and water pollution. Suppose the market demand and supply curves are given by: Demand (MB): P = 400 - 3Qd Supply (MC): P = 200 + Qs Q is tons of steel and P is price per ton of steel. Note in this form, the demand and supply curve are solved for P -- you can see directly the lines on our supply and demand...
What's Hot 3 HP Games Imported From IE U SGIVIUG 13. Suppose the figure to the...
 What's Hot 3 HP Games Imported From IE U SGIVIUG 13. Suppose the figure to the right represents the production of a manufactured good. Production of this good generates volatile organic compounds, which are a type of air pollution. As a result, the cost of production to society is greater than the private cost of production. The marginal private cost of production is represented by MC, and the marginal social cost is represented by MC2 Suppose the government decides to...
 thanks for help^^
Q7 (1 point) The figure below displays the demand curve for Jane's Auto Tune-Ups in the town of Someville. The supply curve captures Jane's marginal cost. Suppose that each tune-up generates one quart of used motor oil. Currently after each tune-up, Jane dumps the quart of used motor oil in the local river. Each quart of oil dumped in the river imposes a cost of $0.30 on each resident that lives in Someville, due to the cost...
thanks for help^^
Q7 (1 point) The figure below displays the demand curve for Jane's Auto Tune-Ups in the town of Someville. The supply curve captures Jane's marginal cost. Suppose that each tune-up generates one quart of used motor oil. Currently after each tune-up, Jane dumps the quart of used motor oil in the local river. Each quart of oil dumped in the river imposes a cost of $0.30 on each resident that lives in Someville, due to the cost...
 The accopmanying graph depicts the marginal social cost (MSC) and marginal social benefit (MSB) of pollution emissions. 1,000 900 Move the point, P, to the point representing the optimal level of pollution. MSC 800 What is the optimal quantity of pollution? 700 Dollars metric tons 400 300 The optimal quantity of pollution is not zero because: 200 MSB O 0 1 2 3 4 5 6 Metric tons of pollution 7 8 9 10 O the marginal social cost of...
 Marginal benefit Marginal social The table below shows information about the costs and benefits of a steel smelter that pollutes the air of a city. The marginal external cost of this pollution is $10 per ton at every quantity of steel produced. Use this information to answer questions 33-35. Quantity of steel (millions of tons cost (dollars per per week) (dollars per ton) 5 40 20 10 35 25 15 30 30 20 25 35 25 20 40 - ton)...
 Marginal Marginal private cost external cost social cost Marginal Quantity (tons of paper) (dollars) (dollars) (dollars) 100 10 5 200 20 10 300 30 15 400 40 20 500 50 25 1) The table above gives the private costs and external costs of producing paper. Complete the table by finding the marginal social cost at each level of production. b. If the market is al competitive and is left unregulated and 400 tons of paper are produced, what is the...
 The graph shows the marginal costs of chemical production. Cost (dollars per ton) Draw an arrow to show the marginal external cost of producing the 3rd ton of chemicals in a week. cost is the cost of producing an additional unit of a good O A. that falls on people other than the producer of the good O B. that is borne by the buyer of the good that falls on the entire society C, O D. that is borne...
 Use Table Below: Coal Mine Pollution. The table shows the
marginal social benefit and cost of various amounts of pollution
from a coal mine. If 5 tons of pollution is produced, the marginal
social benefit is _____, and the marginal social cost is
_____.
$400; $400
$300; $500
$0; $800
$800; $0
Table: Coal Mine Pollution Quantity of Marginal Marginal Pollution Social Social (tons) Benefit Cost $800 $0 700 100 600 200 500 300 400 500 200 600 700 0...
Use Table Below: Coal Mine Pollution. The table shows the
marginal social benefit and cost of various amounts of pollution
from a coal mine. If 5 tons of pollution is produced, the marginal
social benefit is _____, and the marginal social cost is
_____.
$400; $400
$300; $500
$0; $800
$800; $0
Table: Coal Mine Pollution Quantity of Marginal Marginal Pollution Social Social (tons) Benefit Cost $800 $0 700 100 600 200 500 300 400 500 200 600 700 0...
 4. The effect of negative externalities on the optimal quantity of consumption Consider the market for paper. Suppose that a paper factory dumps toxic waste into a nearby river, creating a negative externality for those living downstream from the factory. Producing an additional ton of paper imposes a constant marginal external cost of $100 per ton. The following graph shows the demand curve and the private marginal cost (MC) curve for paper. (Note: The demand for the plant's paper is...
 The graph shows the marginal private benefit from design school education. The marginal cost of this education is a constant $12,000 a year. The marginal external benefit from a design school education is $4,000 per student per year. Suppose the government decides to provide public design schools. Price and cost (thousands of dollars) 28- Draw the marginal cost curve. Label it MC. Draw the marginal social benefit curve. Label it MSB. Draw a line that shows the tuition that schools...
 What's Hot 3 HP Games Imported From IE U SGIVIUG 13. Suppose the figure to the right represents the production of a manufactured good. Production of this good generates volatile organic compounds, which are a type of air pollution. As a result, the cost of production to society is greater than the private cost of production. The marginal private cost of production is represented by MC, and the marginal social cost is represented by MC2 Suppose the government decides to...
Most questions answered within 3 hours.
-
Using MARS simulator, write MIPS programs according to
the following scenarios: Receive a positive integer number...
asked 1 hour ago -
An object in front of a concave mirror has a real image that is
11.5 cm...
asked 1 hour ago -
Consider the reaction, C3 H8 + O2 --> CO2 + H2O. How many
moles of O2...
asked 3 hours ago -
You and your opponent both roll a fair die. If you both roll the
same number,...
asked 3 hours ago -
In a study of the accuracy of fast food drive-through orders,
Restaurant A had 257 accurate...
asked 3 hours ago -
Identify and describe in detail the four categories of
institutions that could be included in a...
asked 3 hours ago -
In python
class Customer:
def __init__(self, customer_id, last_name, first_name, phone_number, address):
self._customer_id = int(customer_id)
self._last_name =...
asked 4 hours ago -
What is an example of a limitation in implementing a new
ERP system and how it...
asked 4 hours ago -
In a section of 9.7cm of an artery with a radius of 2.6mm there
is a...
asked 4 hours ago -
the two carboxylic acid groups of aspartic acid have different
acidities with pKa values of 2.1...
asked 4 hours ago -
Would CuCO3 aqueous salt combined with calcium chloride
form a solid precipitate? If so, what would...
asked 4 hours ago -
How do ECM Solutions assist in embedding a culture of continuous
improvement in an organization? (Project...
asked 4 hours ago