
Homework Answers
We have to test the below hypotheses
H0: µMen=µWomen
HA: µMen ≠ µWomen
We have following information
|
Men |
Women |
|
|
Sample mean |
24.51 |
22.69 |
|
Sample standard deviation |
4.48 |
3.86 |
|
Sample size |
35 |
40 |
Total degrees of freedom is
dftotal =n1 +n2 -2
dftotal =35+40 -2
dftotal =73
Answer(a):
We have the two tailed test, so the critical value for this test will be the table value of t at α/2=0.005 level of significance with 73df.
t(0.995,73) = 2.645
Hence the decision rule is
Reject H0 if t< -2.645 or t > 2.645
Answer(b):
The test statistic to test the null hypothesis is
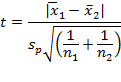
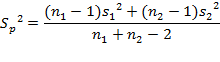
Where sp is pooled standard
deviation
is pooled standard
deviation


The test statistic is


Value of the test statistic = 1.890
Answer(c):
The value of test statistic is within the acceptance region, so we fail to reject the null hypothesis.
The decision is do not reject the null hypothesis that the means are same.
Answer(d):
The p-value of above test is 0.031
p-value = 0.031
Add Answer to:
A recent study focused on the number of times men and women who live alone buy...
A recent study focused on the number of times men and women who live alone buy...
A recent study focused on the number of times men and women who live alone buy take-out dinner in a month. Assume that the distributions follow the normal probability distribution. The information is summarized below. Statistic Men Women Sample mean 25.57 22.33 Population standard deviation 5.58 4.95 Sample size 36 40 At the .01 significance level, is there a difference in the mean number of times men and women order take-out dinners in a...
A recent study focused on the number of times men and women who live alone buy...
A recent study focused on the number of times men and women who live alone buy take-out dinner in a month. Assume that the distributions follow the normal probability distribution and the population standard deviations are equal. The information is summarized below. Statistic Men Women Sample mean 23.82 21.38 Sample standard deviation 5.91 4.87 Sample size 34 36 At the 0.01 significance level, is there a difference in the mean number of times men and women order take-out dinners in...
A recent study focused on the number of times men and women who live alone buy...
A recent study focused on the number of times men and women who live alone buy take-out dinner in a month. Assume that the distributions follow the normal probability distribution and the population standard deviations are equal. The information is summarized below. Statistic Men Women Sample mean 24.71 21.94 Sample standard deviation 5.53 4.71 Sample size 36 41 At the 0.01 significance level, is there a difference in the mean number of times men and women order take-out dinners in...
A recent study focused on the number of times men and women who live alone buy take-out dinner in a month. Assume that the distributions follow the normal probability distribution. The information...
A recent study focused on the number of times men and women who live alone buy take-out dinner in a month. Assume that the distributions follow the normal probability distribution. The information is summarized below. Statistic Men Women Sample mean 25.57 22.33 Population standard deviation 5.58 4.95 Sample size 36 40 At the .01 significance level, is there a difference in the mean number of times men and women order take-out dinners in a month? Hint: Consider the "Men" data...
A recent study focused on the number of times men and women who live alone buy take-out dinner in a month. Assume that the distributions follow the normal probability distribution and the population standard deviations are equal. The information is summar
Sample mean25.5722.33Sample standard deviation5.584.95Sample size3640A recent study focused on the number of times men and women who live alone buy take-out dinner in a month. Assume that the distributions follow the normal probability distribution and the population standard deviations are equal. The information is summarized below.At the 0.01 significance level, is there a difference in the mean number of times men and women order take-out dinners in a month?
Chapter 11 Homework 0 Saved Help Save & Exit Submit Check my work A recent study...
 Chapter 11 Homework 0 Saved Help Save & Exit Submit Check my work A recent study focused on the number of times men and women who live alone buy take-out dinner in a month. Assume that the distributions follow the normal probability distribution and the population standard deviations are equal. The information is summarized below. 4.16 points Statistic Sample mean Sample standard deviation Sample size Men 24.07 5.70 Women 21.55 eBook Punt At the 0.01 significance level, is there a...
7-8 Final Exam Review BUSI 2370.pdf 7) A recent study focused on the number of times...
 7-8
Final Exam Review BUSI 2370.pdf 7) A recent study focused on the number of times men and women send a Twitter message in a day. The information is summarized below. Sample Size Sample Mean Population Standard Deviation 28 23 Women 30 25 Men At the 0.01 significance level, is there a difference in the mean number of times men and women send a Twitter message in a day? Based on the p-value, what is your conclusion? A) Reject the...
7-8
Final Exam Review BUSI 2370.pdf 7) A recent study focused on the number of times men and women send a Twitter message in a day. The information is summarized below. Sample Size Sample Mean Population Standard Deviation 28 23 Women 30 25 Men At the 0.01 significance level, is there a difference in the mean number of times men and women send a Twitter message in a day? Based on the p-value, what is your conclusion? A) Reject the...
3.. A recent study focused on the number of times men and women send a Twitter...
3.. A recent study focused on the number of times men and women send a Twitter message in a day. The information is summarized below. Sample size Sample Mean Population Standard Deviation Men 25 23 5 womean 30 28 10 At the .01 significance level, is there a difference in the mean number of times men and women send a Twitter message in a day? What is the p-value for this hypothesis test? Show all your work
u A study was done on body temperatures of men and women. The results are shown...
 u A study was done on body temperatures of men and women. The results are shown in the table. Assume that the two samples are independent simple random samples selected from normally distributed populations, and do not assume that the population standard deviations are equal. Complete parts (a) and (b) below. Use a 0.05 significance level for both parts Men 11 11 97.76°F 0.81°F Women 2 59 97.45°F 0.71°F S a. Test the claim that men have a higher mean...
Men ?? A study was done on body temperatures of men and women. The results are...
 Men ?? A study was done on body temperatures of men and women. The results are shown in the table Assume that the two samples are independent simple random samples selected ftrom normally distributed populations, and do not assume that the population standard deviations are equal Complete parts (a) and (b) below Use a 0 01 significance level for both parts Women ?2 59 97 45 F 087F The test statistic,1,(Round to two decimal places as needed ) The P-value...
 Chapter 11 Homework 0 Saved Help Save & Exit Submit Check my work A recent study focused on the number of times men and women who live alone buy take-out dinner in a month. Assume that the distributions follow the normal probability distribution and the population standard deviations are equal. The information is summarized below. 4.16 points Statistic Sample mean Sample standard deviation Sample size Men 24.07 5.70 Women 21.55 eBook Punt At the 0.01 significance level, is there a...
 7-8
Final Exam Review BUSI 2370.pdf 7) A recent study focused on the number of times men and women send a Twitter message in a day. The information is summarized below. Sample Size Sample Mean Population Standard Deviation 28 23 Women 30 25 Men At the 0.01 significance level, is there a difference in the mean number of times men and women send a Twitter message in a day? Based on the p-value, what is your conclusion? A) Reject the...
7-8
Final Exam Review BUSI 2370.pdf 7) A recent study focused on the number of times men and women send a Twitter message in a day. The information is summarized below. Sample Size Sample Mean Population Standard Deviation 28 23 Women 30 25 Men At the 0.01 significance level, is there a difference in the mean number of times men and women send a Twitter message in a day? Based on the p-value, what is your conclusion? A) Reject the...
 u A study was done on body temperatures of men and women. The results are shown in the table. Assume that the two samples are independent simple random samples selected from normally distributed populations, and do not assume that the population standard deviations are equal. Complete parts (a) and (b) below. Use a 0.05 significance level for both parts Men 11 11 97.76°F 0.81°F Women 2 59 97.45°F 0.71°F S a. Test the claim that men have a higher mean...
 Men ?? A study was done on body temperatures of men and women. The results are shown in the table Assume that the two samples are independent simple random samples selected ftrom normally distributed populations, and do not assume that the population standard deviations are equal Complete parts (a) and (b) below Use a 0 01 significance level for both parts Women ?2 59 97 45 F 087F The test statistic,1,(Round to two decimal places as needed ) The P-value...
Most questions answered within 3 hours.
-
Calculate the molarity of Fe3+ in solution A.
Solution A: 10 mL of 0.0600 M Fe(No3)3 ...
asked 1 minute ago -
two dogs pull 2 strings horizontally which are tied to a sleigh.
the angle between the...
asked 2 minutes ago -
please write a paper about any ethical violation based on the
case study Stanford's Prison Experiment....
asked 23 minutes ago -
What is the advantage of considering each of the
following in calculating the work done by...
asked 29 minutes ago -
Write a stored function that takes a number as its input and
returns that number as...
asked 28 minutes ago -
In the laboratory, a general chemistry student measured the pH
of a 0.527 M aqueous solution...
asked 35 minutes ago -
Water can decompose into H2 and O2 via electrolysis. How many
moles of H2 could theoretically...
asked 43 minutes ago -
How many moles of oxygen would be consumed during the aerobic
oxidation of one mole of...
asked 59 minutes ago -
Choose an enzyme and tell its function and what substrate it
works on.
asked 58 minutes ago -
You are helping the CFO of a manufacturing company assess
whether the firm should embark on...
asked 53 minutes ago -
a) Given these data for the reaction , write the rate-law
expression.
(Use k for the...
asked 58 minutes ago -
Compare two countries how the culture
of those country enhances or impedes your understanding of the...
asked 59 minutes ago