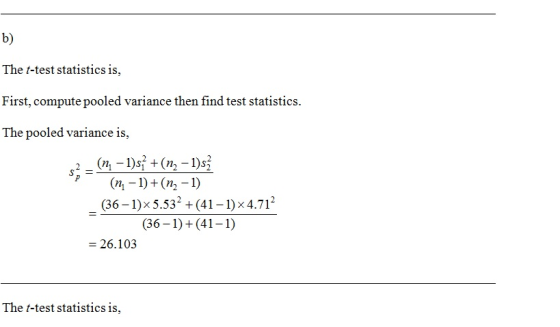
A recent study focused on the number of times men and women who live alone buy...
A recent study focused on the number of times men and women who live alone buy take-out dinner in a month. Assume that the distributions follow the normal probability distribution and the population standard deviations are equal. The information is summarized below.
| Statistic | Men | Women |
| Sample mean | 24.71 | 21.94 |
| Sample standard deviation | 5.53 | 4.71 |
| Sample size | 36 | 41 |
At the 0.01 significance level, is there a difference in the mean number of times men and women order take-out dinners in a month?
-
State the decision rule for 0.01 significance level: H0: μMen= μWomen H1: μMen ≠ μWomen.(Negative amounts should be indicated by a minus sign. Round your answers to 3 decimal places.)
-
Compute the value of the test statistic. (Round your answer to 3 decimal places.)
-
What is your decision regarding the null hypothesis?
-
What is the p-value? (Round your answer to 3 decimal places.)
Homework Answers


Add Answer to:
A recent study focused on the number of times men and women who
live alone buy...
A recent study focused on the number of times men and women who live alone buy...
A recent study focused on the number of times men and women who live alone buy take-out dinner in a month. Assume that the distributions follow the normal probability distribution and the population standard deviations are equal. The information is summarized below. Statistic Men Women Sample mean 23.82 21.38 Sample standard deviation 5.91 4.87 Sample size 34 36 At the 0.01 significance level, is there a difference in the mean number of times men and women order take-out dinners in...
A recent study focused on the number of times men and women who live alone buy...
 A recent study focused on the number of times men and women who live alone buy take-out dinner in a month. Assume that the distributions follow the normal probability distribution and the population standard deviations are equal. The information is summarized below. Statistic Sample mean Sample standard deviation Sample size Men Women 24.51 22.69 4.48 3.86 35 40 difference in the mean number of times men and women order take-out dinners At the 0.01 significance level, is there in a...
A recent study focused on the number of times men and women who live alone buy...
A recent study focused on the number of times men and women who live alone buy take-out dinner in a month. Assume that the distributions follow the normal probability distribution. The information is summarized below. Statistic Men Women Sample mean 25.57 22.33 Population standard deviation 5.58 4.95 Sample size 36 40 At the .01 significance level, is there a difference in the mean number of times men and women order take-out dinners in a...
A recent study focused on the number of times men and women who live alone buy take-out dinner in a month. Assume that the distributions follow the normal probability distribution. The information...
A recent study focused on the number of times men and women who live alone buy take-out dinner in a month. Assume that the distributions follow the normal probability distribution. The information is summarized below. Statistic Men Women Sample mean 25.57 22.33 Population standard deviation 5.58 4.95 Sample size 36 40 At the .01 significance level, is there a difference in the mean number of times men and women order take-out dinners in a month? Hint: Consider the "Men" data...
A recent study focused on the number of times men and women who live alone buy take-out dinner in a month. Assume that the distributions follow the normal probability distribution and the population standard deviations are equal. The information is summar
Sample mean25.5722.33Sample standard deviation5.584.95Sample size3640A recent study focused on the number of times men and women who live alone buy take-out dinner in a month. Assume that the distributions follow the normal probability distribution and the population standard deviations are equal. The information is summarized below.At the 0.01 significance level, is there a difference in the mean number of times men and women order take-out dinners in a month?
3.. A recent study focused on the number of times men and women send a Twitter...
3.. A recent study focused on the number of times men and women send a Twitter message in a day. The information is summarized below. Sample size Sample Mean Population Standard Deviation Men 25 23 5 womean 30 28 10 At the .01 significance level, is there a difference in the mean number of times men and women send a Twitter message in a day? What is the p-value for this hypothesis test? Show all your work
Chapter 11 Homework 0 Saved Help Save & Exit Submit Check my work A recent study...
 Chapter 11 Homework 0 Saved Help Save & Exit Submit Check my work A recent study focused on the number of times men and women who live alone buy take-out dinner in a month. Assume that the distributions follow the normal probability distribution and the population standard deviations are equal. The information is summarized below. 4.16 points Statistic Sample mean Sample standard deviation Sample size Men 24.07 5.70 Women 21.55 eBook Punt At the 0.01 significance level, is there a...
7-8 Final Exam Review BUSI 2370.pdf 7) A recent study focused on the number of times...
 7-8
Final Exam Review BUSI 2370.pdf 7) A recent study focused on the number of times men and women send a Twitter message in a day. The information is summarized below. Sample Size Sample Mean Population Standard Deviation 28 23 Women 30 25 Men At the 0.01 significance level, is there a difference in the mean number of times men and women send a Twitter message in a day? Based on the p-value, what is your conclusion? A) Reject the...
7-8
Final Exam Review BUSI 2370.pdf 7) A recent study focused on the number of times men and women send a Twitter message in a day. The information is summarized below. Sample Size Sample Mean Population Standard Deviation 28 23 Women 30 25 Men At the 0.01 significance level, is there a difference in the mean number of times men and women send a Twitter message in a day? Based on the p-value, what is your conclusion? A) Reject the...
Arbitron Media Research Inc. conducted a study of the iPod listening habits of men and women....
Arbitron Media Research Inc. conducted a study of the iPod listening habits of men and women. One facet of the study involved the mean listening time. It was discovered that the mean listening time for men was 26 minutes per day. The standard deviation of the sample of the 10 men studied was 9 minutes per day. The mean listening time for the 11 women studied was also 26 minutes, but the standard deviation of the sample was 13 minutes....
Arbitron Media Research Inc. conducted a study of the iPod listening habits of men and women....
Arbitron Media Research Inc. conducted a study of the iPod listening habits of men and women. One facet of the study involved the mean listening time. It was discovered that the mean listening time for a sample of 9 men was 43 minutes per day. The standard deviation was 21 minutes per day. The mean listening time for a sample of 8 women was also 43 minutes, but the standard deviation of the sample was 13 minutes. Use a two-tailed...
 A recent study focused on the number of times men and women who live alone buy take-out dinner in a month. Assume that the distributions follow the normal probability distribution and the population standard deviations are equal. The information is summarized below. Statistic Sample mean Sample standard deviation Sample size Men Women 24.51 22.69 4.48 3.86 35 40 difference in the mean number of times men and women order take-out dinners At the 0.01 significance level, is there in a...
 Chapter 11 Homework 0 Saved Help Save & Exit Submit Check my work A recent study focused on the number of times men and women who live alone buy take-out dinner in a month. Assume that the distributions follow the normal probability distribution and the population standard deviations are equal. The information is summarized below. 4.16 points Statistic Sample mean Sample standard deviation Sample size Men 24.07 5.70 Women 21.55 eBook Punt At the 0.01 significance level, is there a...
 7-8
Final Exam Review BUSI 2370.pdf 7) A recent study focused on the number of times men and women send a Twitter message in a day. The information is summarized below. Sample Size Sample Mean Population Standard Deviation 28 23 Women 30 25 Men At the 0.01 significance level, is there a difference in the mean number of times men and women send a Twitter message in a day? Based on the p-value, what is your conclusion? A) Reject the...
7-8
Final Exam Review BUSI 2370.pdf 7) A recent study focused on the number of times men and women send a Twitter message in a day. The information is summarized below. Sample Size Sample Mean Population Standard Deviation 28 23 Women 30 25 Men At the 0.01 significance level, is there a difference in the mean number of times men and women send a Twitter message in a day? Based on the p-value, what is your conclusion? A) Reject the...
Most questions answered within 3 hours.
-
A 10.000 g sample of water contains 11.19% H by mass. what
should be the %H...
asked 3 minutes ago -
Consider an investment game among 2 players. Each player can
either invest,
i, or not invest,-i....
asked 59 seconds ago -
The time taken to complete a particular task is normally
distributed with a standard deviation of...
asked 11 minutes ago -
we have heteroskedasticity in a regression when:
When the variance of error terms changes when an...
asked 20 minutes ago -
Explain some different types of fungi. State the different
divisions undergo by fungi.
asked 33 minutes ago -
The shortest time that 120 C can flow through a 20 A circuit
breaker without tripping...
asked 33 minutes ago -
A software design pattern is a general, reusable solution to a
commonly occurring problem, acting as...
asked 36 minutes ago -
The mean waiting time at the drive-through of a fast-food
restaurant from the time an order...
asked 53 minutes ago -
The pitch (p) of a helix is defined as p = dn, in which n is...
asked 54 minutes ago -
Do you agree that the declining stock of social capital is the
blame for the failure...
asked 58 minutes ago -
A researcher is interested in whether coffee consumption helps
with performance on reading comprehension tasks. The...
asked 1 hour ago -
it has been estimated since the beginning of the human race that
about 133 metric ton...
asked 1 hour ago