A recent study focused on the number of times men and women who live alone buy...
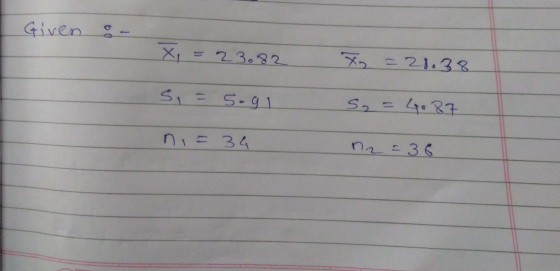
A recent study focused on the number of times men and women who live alone buy take-out dinner in a month. Assume that the distributions follow the normal probability distribution and the population standard deviations are equal. The information is summarized below.
| Statistic | Men | Women |
| Sample mean | 23.82 | 21.38 |
| Sample standard deviation | 5.91 | 4.87 |
| Sample size | 34 | 36 |
At the 0.01 significance level, is there a difference in the mean number of times men and women order take-out dinners in a month?
-
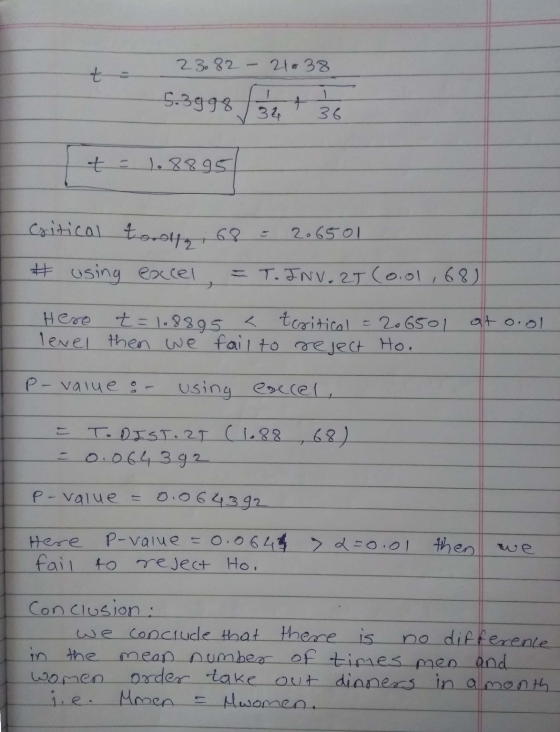
State the decision rule for 0.01 significance level: H0: μMen= μWomen H1: μMen ≠ μWomen. (Negative values should be indicated by a minus sign. Round your answers to 3 decimal places.)
-
Compute the value of the test statistic. (Round your answer to 3 decimal places.)
-
What is your decision regarding the null hypothesis?
-
What is the p-value? (Round your answer to 3 decimal places.)
Homework Answers

Add Answer to:
A recent study focused
on the number of times men and women who live alone buy...
A recent study focused on the number of times men and women who live alone buy...
A recent study focused on the number of times men and women who live alone buy take-out dinner in a month. Assume that the distributions follow the normal probability distribution and the population standard deviations are equal. The information is summarized below. Statistic Men Women Sample mean 24.71 21.94 Sample standard deviation 5.53 4.71 Sample size 36 41 At the 0.01 significance level, is there a difference in the mean number of times men and women order take-out dinners in...
A recent study focused on the number of times men and women who live alone buy...
 A recent study focused on the number of times men and women who live alone buy take-out dinner in a month. Assume that the distributions follow the normal probability distribution and the population standard deviations are equal. The information is summarized below. Statistic Sample mean Sample standard deviation Sample size Men Women 24.51 22.69 4.48 3.86 35 40 difference in the mean number of times men and women order take-out dinners At the 0.01 significance level, is there in a...
A recent study focused on the number of times men and women who live alone buy...
A recent study focused on the number of times men and women who live alone buy take-out dinner in a month. Assume that the distributions follow the normal probability distribution. The information is summarized below. Statistic Men Women Sample mean 25.57 22.33 Population standard deviation 5.58 4.95 Sample size 36 40 At the .01 significance level, is there a difference in the mean number of times men and women order take-out dinners in a...
A recent study focused on the number of times men and women who live alone buy take-out dinner in a month. Assume that the distributions follow the normal probability distribution. The information...
A recent study focused on the number of times men and women who live alone buy take-out dinner in a month. Assume that the distributions follow the normal probability distribution. The information is summarized below. Statistic Men Women Sample mean 25.57 22.33 Population standard deviation 5.58 4.95 Sample size 36 40 At the .01 significance level, is there a difference in the mean number of times men and women order take-out dinners in a month? Hint: Consider the "Men" data...
A recent study focused on the number of times men and women who live alone buy take-out dinner in a month. Assume that the distributions follow the normal probability distribution and the population standard deviations are equal. The information is summar
Sample mean25.5722.33Sample standard deviation5.584.95Sample size3640A recent study focused on the number of times men and women who live alone buy take-out dinner in a month. Assume that the distributions follow the normal probability distribution and the population standard deviations are equal. The information is summarized below.At the 0.01 significance level, is there a difference in the mean number of times men and women order take-out dinners in a month?
3.. A recent study focused on the number of times men and women send a Twitter...
3.. A recent study focused on the number of times men and women send a Twitter message in a day. The information is summarized below. Sample size Sample Mean Population Standard Deviation Men 25 23 5 womean 30 28 10 At the .01 significance level, is there a difference in the mean number of times men and women send a Twitter message in a day? What is the p-value for this hypothesis test? Show all your work
Chapter 11 Homework 0 Saved Help Save & Exit Submit Check my work A recent study...
 Chapter 11 Homework 0 Saved Help Save & Exit Submit Check my work A recent study focused on the number of times men and women who live alone buy take-out dinner in a month. Assume that the distributions follow the normal probability distribution and the population standard deviations are equal. The information is summarized below. 4.16 points Statistic Sample mean Sample standard deviation Sample size Men 24.07 5.70 Women 21.55 eBook Punt At the 0.01 significance level, is there a...
7-8 Final Exam Review BUSI 2370.pdf 7) A recent study focused on the number of times...
 7-8
Final Exam Review BUSI 2370.pdf 7) A recent study focused on the number of times men and women send a Twitter message in a day. The information is summarized below. Sample Size Sample Mean Population Standard Deviation 28 23 Women 30 25 Men At the 0.01 significance level, is there a difference in the mean number of times men and women send a Twitter message in a day? Based on the p-value, what is your conclusion? A) Reject the...
7-8
Final Exam Review BUSI 2370.pdf 7) A recent study focused on the number of times men and women send a Twitter message in a day. The information is summarized below. Sample Size Sample Mean Population Standard Deviation 28 23 Women 30 25 Men At the 0.01 significance level, is there a difference in the mean number of times men and women send a Twitter message in a day? Based on the p-value, what is your conclusion? A) Reject the...
Arbitron Media Research Inc. conducted a study of the iPod listening habits of men and women....
Arbitron Media Research Inc. conducted a study of the iPod listening habits of men and women. One facet of the study involved the mean listening time. It was discovered that the mean listening time for men was 26 minutes per day. The standard deviation of the sample of the 10 men studied was 9 minutes per day. The mean listening time for the 11 women studied was also 26 minutes, but the standard deviation of the sample was 13 minutes....
Arbitron Media Research Inc. conducted a study of the iPod listening habits of men and women....
Arbitron Media Research Inc. conducted a study of the iPod listening habits of men and women. One facet of the study involved the mean listening time. It was discovered that the mean listening time for a sample of 9 men was 43 minutes per day. The standard deviation was 21 minutes per day. The mean listening time for a sample of 8 women was also 43 minutes, but the standard deviation of the sample was 13 minutes. Use a two-tailed...
 A recent study focused on the number of times men and women who live alone buy take-out dinner in a month. Assume that the distributions follow the normal probability distribution and the population standard deviations are equal. The information is summarized below. Statistic Sample mean Sample standard deviation Sample size Men Women 24.51 22.69 4.48 3.86 35 40 difference in the mean number of times men and women order take-out dinners At the 0.01 significance level, is there in a...
 Chapter 11 Homework 0 Saved Help Save & Exit Submit Check my work A recent study focused on the number of times men and women who live alone buy take-out dinner in a month. Assume that the distributions follow the normal probability distribution and the population standard deviations are equal. The information is summarized below. 4.16 points Statistic Sample mean Sample standard deviation Sample size Men 24.07 5.70 Women 21.55 eBook Punt At the 0.01 significance level, is there a...
 7-8
Final Exam Review BUSI 2370.pdf 7) A recent study focused on the number of times men and women send a Twitter message in a day. The information is summarized below. Sample Size Sample Mean Population Standard Deviation 28 23 Women 30 25 Men At the 0.01 significance level, is there a difference in the mean number of times men and women send a Twitter message in a day? Based on the p-value, what is your conclusion? A) Reject the...
7-8
Final Exam Review BUSI 2370.pdf 7) A recent study focused on the number of times men and women send a Twitter message in a day. The information is summarized below. Sample Size Sample Mean Population Standard Deviation 28 23 Women 30 25 Men At the 0.01 significance level, is there a difference in the mean number of times men and women send a Twitter message in a day? Based on the p-value, what is your conclusion? A) Reject the...
Most questions answered within 3 hours.
-
Complete and balance the following reactions. In case of no
reaction occurring write NR.
Mix #1:...
asked 3 minutes ago -
If an economy consumes 75% of any increase in income, then an
increase in autonomous investment...
asked 6 minutes ago -
A shotputter throws the shot with an initial speed of 15.8 m/s
at a 38.0 ∘...
asked 22 minutes ago -
Debra and Merina sell electronic equipment and supplies through
their partnership. They wish to expand their...
asked 23 minutes ago -
How does a linear regression allow you to better estimate
trends, costs, and other factors in...
asked 31 minutes ago -
1. (15%) Describe the difference between a pull (Kanban), push
and CONWIP production systems.
asked 27 minutes ago -
QUESTION 5
The total area under the Z distribution curve is equal to:
a.
10
b....
asked 36 minutes ago -
Using Python
The variables x and y refer to numbers. Write a code segment
that prompts...
asked 50 minutes ago -
If
the coefficient of static friction between a box and the floor is
0.35 with what...
asked 52 minutes ago -
A die is designed to punch holes with a radius of 1.08 10-2 m in
a...
asked 57 minutes ago -
government can increase import through
a. export subsidies
b. tax breaks
c. increase import tax
d....
asked 57 minutes ago -
Draw the following in the proper skeletal structure or line
angle formula.
5,6,6-tribromo-3,8-dicyclopropyl-7-isopentyldodecane
asked 1 hour ago