
Homework Answers
Answer:
(a)
The parameter we are estimating is
People who does not have the Norcovirus
(b)
Point of estimate :-


(c)
Option D
:
(d)
Z-table distribution function we will use
(e)
Margin of Error:-
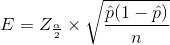
Here:-
Confidence interval = 0.95


(f)
Confidence interval :-


(g)
Option (d) : We are 95% confident that the proportion of the population that does not have the Norcovirus is between the two proportions founds.
Add Answer to:
In a random sample of 316 people that were tested for the Norcovirus, it was found...
10) In a random sample of 450 people aged 20-24, 22% were smokers, random sample of...
 10) In a random sample of 450 people aged 20-24, 22% were smokers, random sample of 400 people aged 25-29, 16% were smokers. a) (4 points) When constructing a confidence interval for the difference between the population proportions of smokers, what must be true in order for the standard normal distribution to be used as an approximation? Show your work please b) (3 points) Construct a 95% confidence interval for the difference between the population proportions of c) (3 points)...
A random sample of 1500 residential telephones in Phoenix found that 390 of the numbers were...
 A random sample of 1500 residential telephones in Phoenix found that 390 of the numbers were unlisted. A random sample in the same year of 1200 telephones in Scottsdale found that 304 were unlisted. Round your answers to four decimal places (e.g. 98.7654). (a) Calculate a 95% two-sided confidence interval on the difference in the proportions of unlisted numbers between the two cities. -0.0336 sp1-p2s 0.0329 (b) Is there a significant difference between the two proportions at a = 0.05?...
Ten engineering schools in a country were surveyed. The sample contained 225 electrical engineers, 80 being...
 Ten engineering schools in a country were surveyed. The sample contained 225 electrical engineers, 80 being women: 175 chemical engineers, 30 being women. Compute a 95% confidence interval for the difference between the proportions of women in these two fields of engineering. Is there a significant difference between the two proportions? Click here to view page 1 of the standard normal distribution table Click here to view page 2 of the standard normal distribution table. Let p, be the population...
9.11.66 Question Help Ten engineering schools in a country were surveyed. The sample contained 275 electrical...
 9.11.66 Question Help Ten engineering schools in a country were surveyed. The sample contained 275 electrical engineers, 80 being women: 150 chemical engineers, 20 being women. Compute a 95% confidence interval for the difference between the proportions of women in these two fields of engineering. Is there a significant difference between the two proportions? Click here to view page 1 of the standard normal distribution table. Click here to view page 2 of the standard normal distribution table. Let P,...
In a random sample of 8 people, the mean commute time to work was 34.5 minutes...
 In a random sample of 8 people, the mean commute time to work was 34.5 minutes and the standard deviation was 7.3 minutes. A 95% confidence interval using the t-distribution was calculated to be (28.4.40.6). After researching commute times to work, it was found that the population standard deviation is 9.4 minutes. Find the margin of error and construct a 95% confidence interval using the standard normal distribution with the appropriate calculations for a standard deviation that is known. Compare...
4 Chapter 7 Test B 16. [Objective: Calculate and interpret confidence intervals for a proportion) A random sample of 950 adult television viewers showed that 48% planned to watch sporting event X...
 4 Chapter 7 Test B 16. [Objective: Calculate and interpret confidence intervals for a proportion) A random sample of 950 adult television viewers showed that 48% planned to watch sporting event X. The margin of error is 4 percentage points with a 95% confidence level. Does the confidence interval support the claim that the majority of adult television viewers plan to watch sporting event X? No; the confidence interval means that we are 95% confident that the population proportion of...
8/15 points 11 Previous Answers IllowskyintroStati 8.HW.123.general. My Notes Ask Your Teacher A telephone poll of 1...
 8/15 points 11 Previous Answers IllowskyintroStati 8.HW.123.general. My Notes Ask Your Teacher A telephone poll of 1000 adult Americans was reported in a magazine. One of the questions asked was "What is the main problem facing the country? Suppose 24% answered "crime". We are interested the main problem. in the population proportion of adult Americans who feel that crime assume that the underlying population is normally distributed. (In general, you must first prove that assumption, though.) NOTE: you are using...
hi there, having trouble with stats homework In a random sample of 22 people, the mean...
 hi there, having trouble with stats homework
In a random sample of 22 people, the mean commute time to work was 31.5 minutes and the standard deviation was 7.3 minutes. Assume the population is normally distributed and use a t-distribution to construct a 80% confidence interval fo the population mean u. What is the margin of error of u? Interpret the results. The confidence interval for the population mean u is ( 29.4, 33.6) (Round to one decimal place as...
hi there, having trouble with stats homework
In a random sample of 22 people, the mean commute time to work was 31.5 minutes and the standard deviation was 7.3 minutes. Assume the population is normally distributed and use a t-distribution to construct a 80% confidence interval fo the population mean u. What is the margin of error of u? Interpret the results. The confidence interval for the population mean u is ( 29.4, 33.6) (Round to one decimal place as...
In a random sample of 8 people, the mean commute time to work was 33.5 minutes...
 In a random sample of 8 people, the mean commute time to work was 33.5 minutes and the standard deviation was 7 4 minutes A 90% confidence interval using the t-distribution was calculated to be (28.5,38.5). After researching commute times to work, it was found that the population standard deviation is 9 5 minutes Find the margin of error and construct a 90% confidence interval using the standard normal distribution with the appropriate calculations for a standard deviation that is...
6.2.19-T Question Help In a random sample of four microwave ovens, the mean repair cost was...
 6.2.19-T Question Help In a random sample of four microwave ovens, the mean repair cost was $85.00 and the standard deviation was $13.00. Assume the population is normally distributed and use a t-distribution to construct a 99% confidence interval for the population mean μ. What is the margin of error of μ? Interpret the results. The 99% confidence interval for the population mean μ is (DD (Round to two decimal places as needed.) 6.2.21-T Question Help In a random sample...
 10) In a random sample of 450 people aged 20-24, 22% were smokers, random sample of 400 people aged 25-29, 16% were smokers. a) (4 points) When constructing a confidence interval for the difference between the population proportions of smokers, what must be true in order for the standard normal distribution to be used as an approximation? Show your work please b) (3 points) Construct a 95% confidence interval for the difference between the population proportions of c) (3 points)...
 A random sample of 1500 residential telephones in Phoenix found that 390 of the numbers were unlisted. A random sample in the same year of 1200 telephones in Scottsdale found that 304 were unlisted. Round your answers to four decimal places (e.g. 98.7654). (a) Calculate a 95% two-sided confidence interval on the difference in the proportions of unlisted numbers between the two cities. -0.0336 sp1-p2s 0.0329 (b) Is there a significant difference between the two proportions at a = 0.05?...
 Ten engineering schools in a country were surveyed. The sample contained 225 electrical engineers, 80 being women: 175 chemical engineers, 30 being women. Compute a 95% confidence interval for the difference between the proportions of women in these two fields of engineering. Is there a significant difference between the two proportions? Click here to view page 1 of the standard normal distribution table Click here to view page 2 of the standard normal distribution table. Let p, be the population...
 9.11.66 Question Help Ten engineering schools in a country were surveyed. The sample contained 275 electrical engineers, 80 being women: 150 chemical engineers, 20 being women. Compute a 95% confidence interval for the difference between the proportions of women in these two fields of engineering. Is there a significant difference between the two proportions? Click here to view page 1 of the standard normal distribution table. Click here to view page 2 of the standard normal distribution table. Let P,...
 In a random sample of 8 people, the mean commute time to work was 34.5 minutes and the standard deviation was 7.3 minutes. A 95% confidence interval using the t-distribution was calculated to be (28.4.40.6). After researching commute times to work, it was found that the population standard deviation is 9.4 minutes. Find the margin of error and construct a 95% confidence interval using the standard normal distribution with the appropriate calculations for a standard deviation that is known. Compare...
 4 Chapter 7 Test B 16. [Objective: Calculate and interpret confidence intervals for a proportion) A random sample of 950 adult television viewers showed that 48% planned to watch sporting event X. The margin of error is 4 percentage points with a 95% confidence level. Does the confidence interval support the claim that the majority of adult television viewers plan to watch sporting event X? No; the confidence interval means that we are 95% confident that the population proportion of...
 8/15 points 11 Previous Answers IllowskyintroStati 8.HW.123.general. My Notes Ask Your Teacher A telephone poll of 1000 adult Americans was reported in a magazine. One of the questions asked was "What is the main problem facing the country? Suppose 24% answered "crime". We are interested the main problem. in the population proportion of adult Americans who feel that crime assume that the underlying population is normally distributed. (In general, you must first prove that assumption, though.) NOTE: you are using...
 hi there, having trouble with stats homework
In a random sample of 22 people, the mean commute time to work was 31.5 minutes and the standard deviation was 7.3 minutes. Assume the population is normally distributed and use a t-distribution to construct a 80% confidence interval fo the population mean u. What is the margin of error of u? Interpret the results. The confidence interval for the population mean u is ( 29.4, 33.6) (Round to one decimal place as...
hi there, having trouble with stats homework
In a random sample of 22 people, the mean commute time to work was 31.5 minutes and the standard deviation was 7.3 minutes. Assume the population is normally distributed and use a t-distribution to construct a 80% confidence interval fo the population mean u. What is the margin of error of u? Interpret the results. The confidence interval for the population mean u is ( 29.4, 33.6) (Round to one decimal place as...
 In a random sample of 8 people, the mean commute time to work was 33.5 minutes and the standard deviation was 7 4 minutes A 90% confidence interval using the t-distribution was calculated to be (28.5,38.5). After researching commute times to work, it was found that the population standard deviation is 9 5 minutes Find the margin of error and construct a 90% confidence interval using the standard normal distribution with the appropriate calculations for a standard deviation that is...
 6.2.19-T Question Help In a random sample of four microwave ovens, the mean repair cost was $85.00 and the standard deviation was $13.00. Assume the population is normally distributed and use a t-distribution to construct a 99% confidence interval for the population mean μ. What is the margin of error of μ? Interpret the results. The 99% confidence interval for the population mean μ is (DD (Round to two decimal places as needed.) 6.2.21-T Question Help In a random sample...
Most questions answered within 3 hours.
-
Blood pressure is normally taken on the upper arm at the level
of the heart. Suppose,...
asked 5 minutes ago -
trust is best established through the combination of ------and
------- .
1. magnanimity and justice
2....
asked 6 minutes ago -
Calculate the [OH (aq)] in limes which have a [H3O*(aq)] of 1.3 x
10 mol/L
asked 6 minutes ago -
Suppose that the satellite around the earth has an orbit that is
24 KM larger in...
asked 8 minutes ago -
A nozzle with a radius of 0.250 cm is attached to a garden hose
with a...
asked 18 minutes ago -
PLEASE do not use any loops for the program; only recursion is
allowed
4. Write a...
asked 26 minutes ago -
Please help me with me. I did the first part to write the operations but in...
asked 23 minutes ago -
Use Cryptool to find the Cryptographic SHA-1 hash value of the
string "abc". The calculator is...
asked 28 minutes ago -
You are attempting to calculate a firm’s free cash flow to
equity. You know the following...
asked 1 hour ago -
the following reaction occurs in a balloon containing
N2O2 gas
N2O4(g)=2NO2(g)
will the volume of the...
asked 1 hour ago -
answer the questions throughout this program
public class Day implements Comparable {
Private Boolean atWork;...
asked 2 hours ago -
This is C++ code for parking fee management program
#include <iostream>
#include <iomanip>
using namespace std;...
asked 2 hours ago