


please help answer questions 1-13.
Homework Answers

Add Answer to:
please help answer questions 1-13.
age *condes Crosstabulation condes Not Condescending Condescending Total age Young Count...
RACE' SES SOCIO-ECONOMIC STATUS Crosstabulation Total 71.0 100.0% 34 34.0 100.0% SES SOCO ECONOMIC STATUS 1...
 RACE' SES SOCIO-ECONOMIC STATUS Crosstabulation Total 71.0 100.0% 34 34.0 100.0% SES SOCO ECONOMIC STATUS 1 LOWER 2 MIDDLE 3 UPPER 23 34 16.4 35.4 19.2 32.4% 47.9% 19.7% 8 14 12 7.9 16.9 9.2 23.5% 41.2% 35.3% 24 24 10 13.4 28.9 15.7 41.4% 41.4% 17.2% 84 227 126 101.2 217.8 118.0 19.2% 51.9% 28.8% 139 299 162 139.0 299.0 162.0 23.2% 49.8% 27.0% RACE HISPANIC Count Expected Count % within RACE 2 ASIAN Count Expected Count % within...
RACE' SES SOCIO-ECONOMIC STATUS Crosstabulation SES I SOCIO-ECONOMIC STATUS 11 LOWER 2 MIDDLE 3 UPPER FRACE...
 RACE' SES SOCIO-ECONOMIC STATUS Crosstabulation SES I SOCIO-ECONOMIC STATUS 11 LOWER 2 MIDDLE 3 UPPER FRACE HISPANIC Count 23 34 14 Expected Count 16.4 35.4 19.2 % within RACE 32.4% 47.9% 19.7% 2 ASIAN Count 8 14 12 Expected Count 7.9 16.9 9.2 % within RACE 23.5% 41.2% 35.3% 3 BLACK Count 24 24 10 Expected Count 13.4 28.9 15.7 % within RACE 41.4% 41.4% 172% 4 WHITE Count 84 227 126 Expocted Count 101.2 217.8 118.0 % within RACE...
My interpretation was incorrect. What would the correct interpretation be? Attached is a screensh...
 My interpretation was incorrect. What would the correct
interpretation be? Attached is a screenshot from SPSS.
A chi-square test of goodness-of-fit test was performed to
determine if there is an equal level of exercise between men and
women. Results indicated that the x2 (3, N=100) = 6.26,
p= .100. There is no significance in level of exercise between men
and women. Gender is not dependent on the level of exercise. These
results were significant at the p <.05 level.
g...
My interpretation was incorrect. What would the correct
interpretation be? Attached is a screenshot from SPSS.
A chi-square test of goodness-of-fit test was performed to
determine if there is an equal level of exercise between men and
women. Results indicated that the x2 (3, N=100) = 6.26,
p= .100. There is no significance in level of exercise between men
and women. Gender is not dependent on the level of exercise. These
results were significant at the p <.05 level.
g...
Problem Set 2: A product developer wanted to know the preferred advertising strategy for a new...
 Problem Set 2: A product developer wanted to know the preferred
advertising strategy for a new toothpaste, and if it differs among
three target demographic groups: 12-24, 25-40, and 40-60 year olds.
There were two versions of advertisements for the toothpaste. Each
person indicated their favorite version of the advertisement, as
indicated in the table below. Did the preferred advertisement
version differ by age group? (Note –conclusions may not be a good
reflection of the data due to the small...
Problem Set 2: A product developer wanted to know the preferred
advertising strategy for a new toothpaste, and if it differs among
three target demographic groups: 12-24, 25-40, and 40-60 year olds.
There were two versions of advertisements for the toothpaste. Each
person indicated their favorite version of the advertisement, as
indicated in the table below. Did the preferred advertisement
version differ by age group? (Note –conclusions may not be a good
reflection of the data due to the small...
8. For this question please refer to Attachment 2. A. Summarize in a seene rinshipsown in the tbles. 6p) B. Identify the control variable. (5p) C. What is the effect of the control variable? (e...
 8. For this question please refer to Attachment 2. A. Summarize in a seene rinshipsown in the tbles. 6p) B. Identify the control variable. (5p) C. What is the effect of the control variable? (e.g., change in intensity, direction, little or no change). Justify your answer. (1p) D. What does 23.1% in the crosstabs table represent? (5p) Attachment 2: Variables Degree (Recoded Degree) and Frequency of giving (recoded Frequency of contributing money to charity). frequency of giving Degree Crosstabulation At...
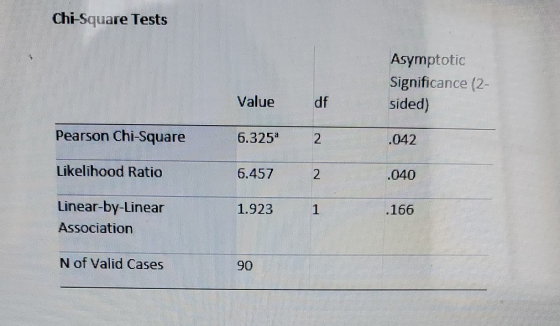
Describe explain what the results mean Chi-Square Tests Value df Asymptotic Significance (2-sided) Pearson Chi-Square 65.638a...
Describe explain what the results mean Chi-Square Tests Value df Asymptotic Significance (2-sided) Pearson Chi-Square 65.638a 3 .000 Likelihood Ratio 50.911 3 .000 Linear-by-Linear Association 46.587 1 .000 N of Valid Cases 495 a. 1 cells (12.5%) have expected count less than 5. The minimum expected count is 4.82.
#8. Now look at the relationship between marital status (MSTAT) and college graduation using a chi-square...
#8. Now look at the relationship between marital status (MSTAT) and college graduation using a chi-square test. What would you conclude? A. Married people are more often college graduates than singles B. College graduates are more often married than non-graduates C. There is not a significant relationship between marital status and college graduation D. Both “a” and “b” are true Using alpha = .05 Case Processing Summary Cases Valid Missing Total N Percent N Percent N Percent Marital Status *...
A survey of children under 15 years of age residing in the inner-city area of a large city were classified according to ethnic group and hemoglobin level. The results are attached. Do these data prov...
 A survey of children under 15 years of age residing in the inner-city area of a large city were classified according to ethnic group and hemoglobin level. The results are attached. Do these data provide sufficient evidence to indicate, at the .05 level of significance, that the two variables are related? What is the p value for this test? Ethnic Group 9.0-9.9 9.0 Total 10.0 or Greater 80 70 249 1 OO 1 90 30 20 96 200 385 11O...
EVER BEEN DIVORCED OR SEPARATED * DEALING WITH DRUG ADDICTION Crosstabulation DEALING WITH DRUG ADDICTION Total...
EVER BEEN DIVORCED OR SEPARATED * DEALING WITH DRUG ADDICTION Crosstabulation DEALING WITH DRUG ADDICTION Total TOO LITTLE ABOUT RIGHT TOO MUCH EVER BEEN DIVORCED OR SEPARATED YES Count 147 84 32 263 % within DEALING WITH DRUG ADDICTION 26.1% 26.9% 26.4% 26.4% NO Count 417 228 89 734 % within DEALING WITH DRUG ADDICTION 73.9% 73.1% 73.6% 73.6% Total Count 564 312 121 997 % within DEALING WITH DRUG ADDICTION 100.0% 100.0% 100.0% 100.0% The description of this table...
I'm not sure how to enter the data. I've tried and it looks wrong. Also C, D, E, F is what I need...
 I'm not sure how to enter the data. I've tried and it looks
wrong. Also C, D, E, F is what I need help with as well. I've
attached a copy of my output please tell me what I am doing wrong.
I would like to know how to enter the data correctly.
Out put I keep getting but it looks as if it's off. what am I
doing wrong?
Exercise for Chapter 17 You will be analyzing the data...
I'm not sure how to enter the data. I've tried and it looks
wrong. Also C, D, E, F is what I need help with as well. I've
attached a copy of my output please tell me what I am doing wrong.
I would like to know how to enter the data correctly.
Out put I keep getting but it looks as if it's off. what am I
doing wrong?
Exercise for Chapter 17 You will be analyzing the data...
 RACE' SES SOCIO-ECONOMIC STATUS Crosstabulation Total 71.0 100.0% 34 34.0 100.0% SES SOCO ECONOMIC STATUS 1 LOWER 2 MIDDLE 3 UPPER 23 34 16.4 35.4 19.2 32.4% 47.9% 19.7% 8 14 12 7.9 16.9 9.2 23.5% 41.2% 35.3% 24 24 10 13.4 28.9 15.7 41.4% 41.4% 17.2% 84 227 126 101.2 217.8 118.0 19.2% 51.9% 28.8% 139 299 162 139.0 299.0 162.0 23.2% 49.8% 27.0% RACE HISPANIC Count Expected Count % within RACE 2 ASIAN Count Expected Count % within...
 RACE' SES SOCIO-ECONOMIC STATUS Crosstabulation SES I SOCIO-ECONOMIC STATUS 11 LOWER 2 MIDDLE 3 UPPER FRACE HISPANIC Count 23 34 14 Expected Count 16.4 35.4 19.2 % within RACE 32.4% 47.9% 19.7% 2 ASIAN Count 8 14 12 Expected Count 7.9 16.9 9.2 % within RACE 23.5% 41.2% 35.3% 3 BLACK Count 24 24 10 Expected Count 13.4 28.9 15.7 % within RACE 41.4% 41.4% 172% 4 WHITE Count 84 227 126 Expocted Count 101.2 217.8 118.0 % within RACE...
 My interpretation was incorrect. What would the correct
interpretation be? Attached is a screenshot from SPSS.
A chi-square test of goodness-of-fit test was performed to
determine if there is an equal level of exercise between men and
women. Results indicated that the x2 (3, N=100) = 6.26,
p= .100. There is no significance in level of exercise between men
and women. Gender is not dependent on the level of exercise. These
results were significant at the p <.05 level.
g...
My interpretation was incorrect. What would the correct
interpretation be? Attached is a screenshot from SPSS.
A chi-square test of goodness-of-fit test was performed to
determine if there is an equal level of exercise between men and
women. Results indicated that the x2 (3, N=100) = 6.26,
p= .100. There is no significance in level of exercise between men
and women. Gender is not dependent on the level of exercise. These
results were significant at the p <.05 level.
g...
 Problem Set 2: A product developer wanted to know the preferred
advertising strategy for a new toothpaste, and if it differs among
three target demographic groups: 12-24, 25-40, and 40-60 year olds.
There were two versions of advertisements for the toothpaste. Each
person indicated their favorite version of the advertisement, as
indicated in the table below. Did the preferred advertisement
version differ by age group? (Note –conclusions may not be a good
reflection of the data due to the small...
Problem Set 2: A product developer wanted to know the preferred
advertising strategy for a new toothpaste, and if it differs among
three target demographic groups: 12-24, 25-40, and 40-60 year olds.
There were two versions of advertisements for the toothpaste. Each
person indicated their favorite version of the advertisement, as
indicated in the table below. Did the preferred advertisement
version differ by age group? (Note –conclusions may not be a good
reflection of the data due to the small...
 8. For this question please refer to Attachment 2. A. Summarize in a seene rinshipsown in the tbles. 6p) B. Identify the control variable. (5p) C. What is the effect of the control variable? (e.g., change in intensity, direction, little or no change). Justify your answer. (1p) D. What does 23.1% in the crosstabs table represent? (5p) Attachment 2: Variables Degree (Recoded Degree) and Frequency of giving (recoded Frequency of contributing money to charity). frequency of giving Degree Crosstabulation At...
 A survey of children under 15 years of age residing in the inner-city area of a large city were classified according to ethnic group and hemoglobin level. The results are attached. Do these data provide sufficient evidence to indicate, at the .05 level of significance, that the two variables are related? What is the p value for this test? Ethnic Group 9.0-9.9 9.0 Total 10.0 or Greater 80 70 249 1 OO 1 90 30 20 96 200 385 11O...
 I'm not sure how to enter the data. I've tried and it looks
wrong. Also C, D, E, F is what I need help with as well. I've
attached a copy of my output please tell me what I am doing wrong.
I would like to know how to enter the data correctly.
Out put I keep getting but it looks as if it's off. what am I
doing wrong?
Exercise for Chapter 17 You will be analyzing the data...
I'm not sure how to enter the data. I've tried and it looks
wrong. Also C, D, E, F is what I need help with as well. I've
attached a copy of my output please tell me what I am doing wrong.
I would like to know how to enter the data correctly.
Out put I keep getting but it looks as if it's off. what am I
doing wrong?
Exercise for Chapter 17 You will be analyzing the data...
Most questions answered within 3 hours.
-
Little’s Law: Val d’Costa is a world famous ski village in the
French Alps. Because of...
asked 4 minutes ago -
Find the absolute error D for the calculation if A + B/C=D A=
9.4 +/- 0.4...
asked 18 minutes ago -
New Air Heating and Cooling, manufactures furnaces and central
air units. The company pride itself on...
asked 31 minutes ago -
A coach uses a new technique to train gymnasts. Seven
gymnasts were randomly selected and their...
asked 2 hours ago -
While rotating the tires on your car you notice a rock [mass =
0.1 Kg] stuck...
asked 4 hours ago -
Using MARS simulator, write MIPS programs according to
the following scenarios: Receive a positive integer number...
asked 6 hours ago -
An object in front of a concave mirror has a real image that is
11.5 cm...
asked 6 hours ago -
Consider the reaction, C3 H8 + O2 --> CO2 + H2O. How many
moles of O2...
asked 8 hours ago -
You and your opponent both roll a fair die. If you both roll the
same number,...
asked 8 hours ago -
In a study of the accuracy of fast food drive-through orders,
Restaurant A had 257 accurate...
asked 8 hours ago -
Identify and describe in detail the four categories of
institutions that could be included in a...
asked 8 hours ago -
In python
class Customer:
def __init__(self, customer_id, last_name, first_name, phone_number, address):
self._customer_id = int(customer_id)
self._last_name =...
asked 8 hours ago