My interpretation was incorrect. What would the correct interpretation be? Attached is a screenshot from SPSS.
A chi-square test of goodness-of-fit test was performed to
determine if there is an equal level of exercise between men and
women. Results indicated that the x2 (3, N=100) = 6.26,
p= .100. There is no significance in level of exercise between men
and women. Gender is not dependent on the level of exercise. These
results were significant at the p <.05 level.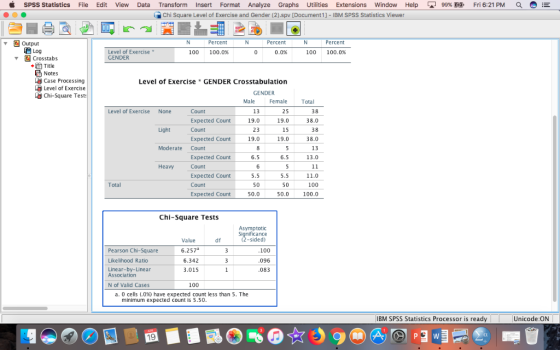
Homework Answers
Answer
your interpretation is 90% correct, but you made incorrect conclusion in the end.
A chi-square test of goodness-of-fit test was performed to determine if there is an equal level of exercise between men and women. Results indicated that the x2 (3, N=100) = 6.26, p= .100. There is no significant difference in level of exercise between men and women because the p value corresponding to the hypothesis is 0.100, which is greater than the significance level of 0.05. Gender is not dependent on the level of exercise. These results were insignificant at the 0.05 significance level because observed p value (0.100) is more than 0.05 level.
Add Answer to:
My interpretation was incorrect. What would the correct interpretation be? Attached is a screensh...
I'm not sure how to enter the data. I've tried and it looks wrong. Also C, D, E, F is what I need...
 I'm not sure how to enter the data. I've tried and it looks
wrong. Also C, D, E, F is what I need help with as well. I've
attached a copy of my output please tell me what I am doing wrong.
I would like to know how to enter the data correctly.
Out put I keep getting but it looks as if it's off. what am I
doing wrong?
Exercise for Chapter 17 You will be analyzing the data...
I'm not sure how to enter the data. I've tried and it looks
wrong. Also C, D, E, F is what I need help with as well. I've
attached a copy of my output please tell me what I am doing wrong.
I would like to know how to enter the data correctly.
Out put I keep getting but it looks as if it's off. what am I
doing wrong?
Exercise for Chapter 17 You will be analyzing the data...
please help answer questions 1-13. age *condes Crosstabulation condes Not Condescending Condescending Total age Young Count...
 please help answer questions 1-13.
age *condes Crosstabulation condes Not Condescending Condescending Total age Young Count 21 9 30 Expected Count 20.7 9.3 30.0 % within age 70.0% 30.0% 100.0% Middle-Aged Count 25 5 30 Expected Count 20.7 9.3 30.0 % within age 83.3% 16.7% 100.0% Elderly Count 16 14 30 Expected Count 20.7 9.3 30.0 % within age 53.3% 46.7% 100.0% Total Count 62 28 90 Expected Count 62.0 28.0 90.0 % within age 68.9% 31.1% 100.0% Chi-Square Tests...
please help answer questions 1-13.
age *condes Crosstabulation condes Not Condescending Condescending Total age Young Count 21 9 30 Expected Count 20.7 9.3 30.0 % within age 70.0% 30.0% 100.0% Middle-Aged Count 25 5 30 Expected Count 20.7 9.3 30.0 % within age 83.3% 16.7% 100.0% Elderly Count 16 14 30 Expected Count 20.7 9.3 30.0 % within age 53.3% 46.7% 100.0% Total Count 62 28 90 Expected Count 62.0 28.0 90.0 % within age 68.9% 31.1% 100.0% Chi-Square Tests...
8. For this question please refer to Attachment 2. A. Summarize in a seene rinshipsown in the tbles. 6p) B. Identify the control variable. (5p) C. What is the effect of the control variable? (e...
 8. For this question please refer to Attachment 2. A. Summarize in a seene rinshipsown in the tbles. 6p) B. Identify the control variable. (5p) C. What is the effect of the control variable? (e.g., change in intensity, direction, little or no change). Justify your answer. (1p) D. What does 23.1% in the crosstabs table represent? (5p) Attachment 2: Variables Degree (Recoded Degree) and Frequency of giving (recoded Frequency of contributing money to charity). frequency of giving Degree Crosstabulation At...
#8. Now look at the relationship between marital status (MSTAT) and college graduation using a chi-square...
#8. Now look at the relationship between marital status (MSTAT) and college graduation using a chi-square test. What would you conclude? A. Married people are more often college graduates than singles B. College graduates are more often married than non-graduates C. There is not a significant relationship between marital status and college graduation D. Both “a” and “b” are true Using alpha = .05 Case Processing Summary Cases Valid Missing Total N Percent N Percent N Percent Marital Status *...
A survey of children under 15 years of age residing in the inner-city area of a large city were classified according to ethnic group and hemoglobin level. The results are attached. Do these data prov...
 A survey of children under 15 years of age residing in the inner-city area of a large city were classified according to ethnic group and hemoglobin level. The results are attached. Do these data provide sufficient evidence to indicate, at the .05 level of significance, that the two variables are related? What is the p value for this test? Ethnic Group 9.0-9.9 9.0 Total 10.0 or Greater 80 70 249 1 OO 1 90 30 20 96 200 385 11O...
Homework D-Statistics for Independent Group Comparisons Summer 2018 eferences Mailings Review View Help Tell me what...
 Homework D-Statistics for Independent Group Comparisons Summer 2018 eferences Mailings Review View Help Tell me what you want to do Word 10. Using the SPSS table below, which standard residual(s) are important for the investigators to note? a. Above poverty level b. Divorced c. Married d. Below Poverty level Current Marital Status Poverty Level Crosstabulation Poverty Level below poverty a above povert Current Marital Stabus married 19.0 Expected Count % within Current Marital 9.0 607% 28.0 1000% | 393%| %...
Congenital sensorineural deafness is the most common form of deafness in dogs and is often associ...
 Congenital sensorineural deafness is the most common form of deafness in dogs and is often associated with congenital pigmentation deficiencies. A study of hearing impairment in dogs examined over 5000 dalmatians for both hearing impairment and iris color. The provided figure shows the SPSS output for a chi-square test on these data. SPSS Hearing EyeColor Crosstabulation EyeColor BrownBlue eyed eyedTotal Hearing Deaf Count Expected Count % within Eyecolor | 381.7 6.8% | 102 44.3 426.0 18.4% | 80% 179 1167...
Problem Set 2: A product developer wanted to know the preferred advertising strategy for a new...
 Problem Set 2: A product developer wanted to know the preferred
advertising strategy for a new toothpaste, and if it differs among
three target demographic groups: 12-24, 25-40, and 40-60 year olds.
There were two versions of advertisements for the toothpaste. Each
person indicated their favorite version of the advertisement, as
indicated in the table below. Did the preferred advertisement
version differ by age group? (Note –conclusions may not be a good
reflection of the data due to the small...
Problem Set 2: A product developer wanted to know the preferred
advertising strategy for a new toothpaste, and if it differs among
three target demographic groups: 12-24, 25-40, and 40-60 year olds.
There were two versions of advertisements for the toothpaste. Each
person indicated their favorite version of the advertisement, as
indicated in the table below. Did the preferred advertisement
version differ by age group? (Note –conclusions may not be a good
reflection of the data due to the small...
look at each test on pic above and answer the question below: Interpret the result in APA stat (1a) Is there a statistically significant difference in academic performance in 2000...
 look at each test on pic above and answer the question below:
Interpret the result in APA stat
(1a) Is there a statistically significant difference in
academic performance in 2000 according to the socioeconomic
standing of the school as measured by the percentage of students
that receive free meals? Explain.
one-way anova
(1b) Is there a statistically significant difference in
academic performance in 1999 between year-round and non-year-round
schools? How do you know? Explain?
Independent t test
(1c) Determine if...
look at each test on pic above and answer the question below:
Interpret the result in APA stat
(1a) Is there a statistically significant difference in
academic performance in 2000 according to the socioeconomic
standing of the school as measured by the percentage of students
that receive free meals? Explain.
one-way anova
(1b) Is there a statistically significant difference in
academic performance in 1999 between year-round and non-year-round
schools? How do you know? Explain?
Independent t test
(1c) Determine if...
Condition (Truthful Bragger = 1 v. Nonbragger = 2) Do you think Edward is a braggart?...
 Condition (Truthful Bragger = 1 v. Nonbragger = 2) Do you think Edward is a braggart? (Yes or no) Crosstabulation Do you think Edward is a braggart? (Yes or no) Yes No 23 76.7% 23.3% Truthful Bragger Condition (Truthful Bragger = 1 v. Nonbragger = 2) Total 30 100.0% Nonbragger 30 Count % within Condition (Truthful Bragger = 1 v. Nonbragger = 2) Count % within Condition (Truthful Bragger = 1 v. Nonbragger = 2) Count % within Condition (Truthful...
 I'm not sure how to enter the data. I've tried and it looks
wrong. Also C, D, E, F is what I need help with as well. I've
attached a copy of my output please tell me what I am doing wrong.
I would like to know how to enter the data correctly.
Out put I keep getting but it looks as if it's off. what am I
doing wrong?
Exercise for Chapter 17 You will be analyzing the data...
I'm not sure how to enter the data. I've tried and it looks
wrong. Also C, D, E, F is what I need help with as well. I've
attached a copy of my output please tell me what I am doing wrong.
I would like to know how to enter the data correctly.
Out put I keep getting but it looks as if it's off. what am I
doing wrong?
Exercise for Chapter 17 You will be analyzing the data...
 please help answer questions 1-13.
age *condes Crosstabulation condes Not Condescending Condescending Total age Young Count 21 9 30 Expected Count 20.7 9.3 30.0 % within age 70.0% 30.0% 100.0% Middle-Aged Count 25 5 30 Expected Count 20.7 9.3 30.0 % within age 83.3% 16.7% 100.0% Elderly Count 16 14 30 Expected Count 20.7 9.3 30.0 % within age 53.3% 46.7% 100.0% Total Count 62 28 90 Expected Count 62.0 28.0 90.0 % within age 68.9% 31.1% 100.0% Chi-Square Tests...
please help answer questions 1-13.
age *condes Crosstabulation condes Not Condescending Condescending Total age Young Count 21 9 30 Expected Count 20.7 9.3 30.0 % within age 70.0% 30.0% 100.0% Middle-Aged Count 25 5 30 Expected Count 20.7 9.3 30.0 % within age 83.3% 16.7% 100.0% Elderly Count 16 14 30 Expected Count 20.7 9.3 30.0 % within age 53.3% 46.7% 100.0% Total Count 62 28 90 Expected Count 62.0 28.0 90.0 % within age 68.9% 31.1% 100.0% Chi-Square Tests...
 8. For this question please refer to Attachment 2. A. Summarize in a seene rinshipsown in the tbles. 6p) B. Identify the control variable. (5p) C. What is the effect of the control variable? (e.g., change in intensity, direction, little or no change). Justify your answer. (1p) D. What does 23.1% in the crosstabs table represent? (5p) Attachment 2: Variables Degree (Recoded Degree) and Frequency of giving (recoded Frequency of contributing money to charity). frequency of giving Degree Crosstabulation At...
 A survey of children under 15 years of age residing in the inner-city area of a large city were classified according to ethnic group and hemoglobin level. The results are attached. Do these data provide sufficient evidence to indicate, at the .05 level of significance, that the two variables are related? What is the p value for this test? Ethnic Group 9.0-9.9 9.0 Total 10.0 or Greater 80 70 249 1 OO 1 90 30 20 96 200 385 11O...
 Homework D-Statistics for Independent Group Comparisons Summer 2018 eferences Mailings Review View Help Tell me what you want to do Word 10. Using the SPSS table below, which standard residual(s) are important for the investigators to note? a. Above poverty level b. Divorced c. Married d. Below Poverty level Current Marital Status Poverty Level Crosstabulation Poverty Level below poverty a above povert Current Marital Stabus married 19.0 Expected Count % within Current Marital 9.0 607% 28.0 1000% | 393%| %...
 Congenital sensorineural deafness is the most common form of deafness in dogs and is often associated with congenital pigmentation deficiencies. A study of hearing impairment in dogs examined over 5000 dalmatians for both hearing impairment and iris color. The provided figure shows the SPSS output for a chi-square test on these data. SPSS Hearing EyeColor Crosstabulation EyeColor BrownBlue eyed eyedTotal Hearing Deaf Count Expected Count % within Eyecolor | 381.7 6.8% | 102 44.3 426.0 18.4% | 80% 179 1167...
 Problem Set 2: A product developer wanted to know the preferred
advertising strategy for a new toothpaste, and if it differs among
three target demographic groups: 12-24, 25-40, and 40-60 year olds.
There were two versions of advertisements for the toothpaste. Each
person indicated their favorite version of the advertisement, as
indicated in the table below. Did the preferred advertisement
version differ by age group? (Note –conclusions may not be a good
reflection of the data due to the small...
Problem Set 2: A product developer wanted to know the preferred
advertising strategy for a new toothpaste, and if it differs among
three target demographic groups: 12-24, 25-40, and 40-60 year olds.
There were two versions of advertisements for the toothpaste. Each
person indicated their favorite version of the advertisement, as
indicated in the table below. Did the preferred advertisement
version differ by age group? (Note –conclusions may not be a good
reflection of the data due to the small...
 look at each test on pic above and answer the question below:
Interpret the result in APA stat
(1a) Is there a statistically significant difference in
academic performance in 2000 according to the socioeconomic
standing of the school as measured by the percentage of students
that receive free meals? Explain.
one-way anova
(1b) Is there a statistically significant difference in
academic performance in 1999 between year-round and non-year-round
schools? How do you know? Explain?
Independent t test
(1c) Determine if...
look at each test on pic above and answer the question below:
Interpret the result in APA stat
(1a) Is there a statistically significant difference in
academic performance in 2000 according to the socioeconomic
standing of the school as measured by the percentage of students
that receive free meals? Explain.
one-way anova
(1b) Is there a statistically significant difference in
academic performance in 1999 between year-round and non-year-round
schools? How do you know? Explain?
Independent t test
(1c) Determine if...
 Condition (Truthful Bragger = 1 v. Nonbragger = 2) Do you think Edward is a braggart? (Yes or no) Crosstabulation Do you think Edward is a braggart? (Yes or no) Yes No 23 76.7% 23.3% Truthful Bragger Condition (Truthful Bragger = 1 v. Nonbragger = 2) Total 30 100.0% Nonbragger 30 Count % within Condition (Truthful Bragger = 1 v. Nonbragger = 2) Count % within Condition (Truthful Bragger = 1 v. Nonbragger = 2) Count % within Condition (Truthful...
Most questions answered within 3 hours.
-
284 mL of a 0.52 M potassium hydroxide solution is added to 467
mL of a...
asked 6 minutes ago -
exercise on VSEPR and molecular structrue.
octahedral
SeCl62-
TeCl62-
ClF62-
distorted
SeF62–
IF6–
asked 8 minutes ago -
Little’s Law: Val d’Costa is a world famous ski village in the
French Alps. Because of...
asked 1 hour ago -
Find the absolute error D for the calculation if A + B/C=D A=
9.4 +/- 0.4...
asked 1 hour ago -
New Air Heating and Cooling, manufactures furnaces and central
air units. The company pride itself on...
asked 1 hour ago -
A coach uses a new technique to train gymnasts. Seven
gymnasts were randomly selected and their...
asked 3 hours ago -
While rotating the tires on your car you notice a rock [mass =
0.1 Kg] stuck...
asked 5 hours ago -
Using MARS simulator, write MIPS programs according to
the following scenarios: Receive a positive integer number...
asked 7 hours ago -
An object in front of a concave mirror has a real image that is
11.5 cm...
asked 7 hours ago -
Consider the reaction, C3 H8 + O2 --> CO2 + H2O. How many
moles of O2...
asked 9 hours ago -
You and your opponent both roll a fair die. If you both roll the
same number,...
asked 9 hours ago -
In a study of the accuracy of fast food drive-through orders,
Restaurant A had 257 accurate...
asked 9 hours ago