
801 o 70 60 。50 5 40 S 30 10- 0 Deaf Unilat. Bilat. Blue Deaf Unilat. Blat Brown Bar graph lI
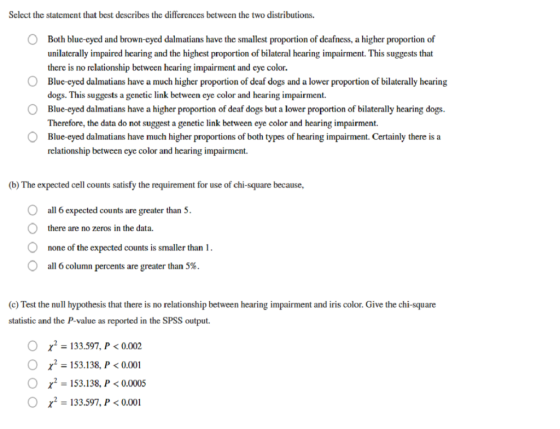
Select the statement that best describes the differences between the two distributions. O Both blue-eyed and brown-eyed dalmatians have the smallest proportion of deafness, a higher proportion of O O O unilaterally impaired hearing and the highest proportion of bilateral hearing impairment. This suggests that there is no relationship between hearing impairment and cye color Blue cyed dalmatians have a much higher proportion of deaf dogs and a lower proportion of bilaterally hearing dogs. This suggests a genetic link between eye color and hearing impairment. Blue-eyed dalmatians have a higher proportion of deaf dogs but a lower proportion of bilaterally hearing dogs. Therefore, the data do not suggest a genetic link between eye color and hearing impairment. Blue-eyed dalmatians have much higher proportions of both types of hearing impairment. Certainly there is a relationship between eye color and hearing impairment. (b) The expected cell counts satisfy the requirement for use of chi-square because, O all 6 expected counts are greater than 5 there are no zeros in the data. none of the expected counts is smaller than 1 all 6 column percents are greater than 5% O (c) Test the null hypothesis that there is no relationship between hearing impairment and iris color. Give the chi-square statistic and the P-value as reported in the SPSS output O2133.597, P 0.002 O 2153.138, P
Homework Answers
Select the statement that best describes the difference between
the two distributions
Blue-eyed dalmations have much higher proportion of deaf dogs and a
lower proportion of bilaterally hearing dogs. This suggests a
genetic link between eye colour and hearing impairment.
The expected cell counts satisfy the requirement for use of
chi-square because
all 6 expected counts are greater than 5
c. test statistic
chi-square = 153.138, P<0.001
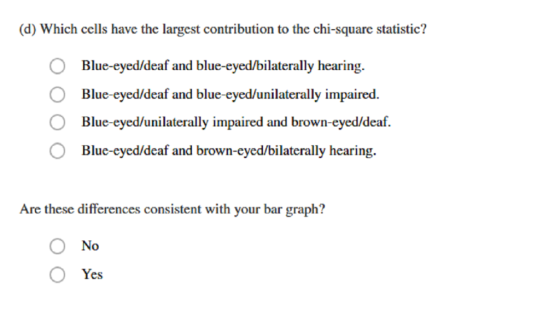
d. Which cells have the largest contribution to the chi-square statistic?
Blue-eyed deaf and blue-eyed bilaterally hearing
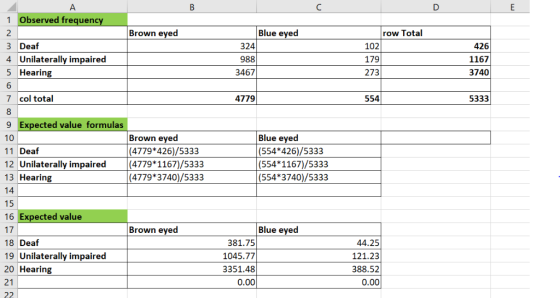
The calculation is shown below.

are these difference consistent with your bar
graph?
Yes
Add Answer to:
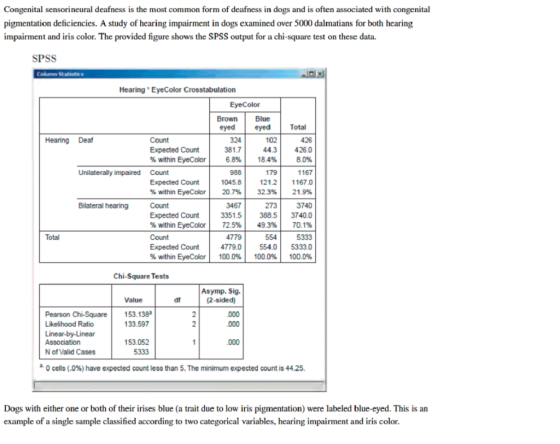
Congenital sensorineural deafness is the most common form of deafness in dogs and is often associ...
Questions 45-46: Consider the following partial table of a sample of 60 M&Ms. We count how...
 Questions 45-46: Consider the following partial table of a sample of 60 M&Ms. We count how many of each color are present. We are testing the null hypothesis that each color has the stated proportion. Observed Counts Assumed Proportions Expected Counts 0.24 13 14 0.20 10 0.16 Color Blue Orange Green Yellow Red Brown Total 11 0.14 6 0.13 6 0.13 60 1.00 60 45. If the null hypothesis is correct, how many orange M&Ms do we expect to see...
42. The following StatCrunch output shows the results for a one-sample proportions test. Choose the best...
 42. The following StatCrunch output shows the results for a one-sample proportions test. Choose the best interpretation of the p-value.:* One sample Proportion with summary DOX Options Hypothesis test results: p proportion of successes for population Ho p = 0.5 HAD 0.5 Proportion Count Total Sample Prop. Std. Err. P-value 174 0.58 0.028867513 2.7712812 0.0056 Z-Stat p 300 Java Applet Window O a. The probability that the alternative hypothesis is correct. Ob. The probability that we correctly reject the null...
Match the following terms with the appropriate description below: a. alleles b. autosomes c. dominant allele...
 Match the following terms with the appropriate description
below:
a. alleles b. autosomes c. dominant allele d. genotype e.
heterozygous f. homozygote g. phenotype h. recessive allele i. sex
chromosomes
1. ________________ genetic make-up
2. ________________ how genetic make-up is expressed
3. ________________ chromosomes that dictate most body
characteristics
4. ________________ alternative forms of the same gene
5. ___________an individual bearing two alleles that are the same
for a particular trait 6. ________________ an allele that is
expressed, whether in...
Match the following terms with the appropriate description
below:
a. alleles b. autosomes c. dominant allele d. genotype e.
heterozygous f. homozygote g. phenotype h. recessive allele i. sex
chromosomes
1. ________________ genetic make-up
2. ________________ how genetic make-up is expressed
3. ________________ chromosomes that dictate most body
characteristics
4. ________________ alternative forms of the same gene
5. ___________an individual bearing two alleles that are the same
for a particular trait 6. ________________ an allele that is
expressed, whether in...
On the island of Notion, in the Factotum Archipelago, there lives a population of pencil bears....
On the island of Notion, in the Factotum Archipelago, there lives a population of pencil bears. A portion of these bears have silky fur, and as a result, are much better surfers. The texture of the fur is determined by a single autosomal locus with two alleles: S (trait allele) and s (wild type allele). In a recent study, researched collected the values in the following table: Table 1. Counts of Pencil Bear fur style by genotype Phenotype Genotype Silky...
Practice questions for BIO 340 (Exam 2) I need help with these questions Please. WILL GIVE...
 Practice questions for BIO 340 (Exam 2) I need help with these
questions Please. WILL GIVE GOOD RATING
1. Wild type blue-eyed mary has blue flowers. Two genes control the pathway that makes the blue pigment: The product of gene W turns a white precursor into magenta pigment. The product of gene M turns the magenta pigment into blue pigment. Each gene has a recessive loss-of-function allele: w and m, respectively. A double heterozygote (Ww Mm) is self-pollinated. What proportion...
Practice questions for BIO 340 (Exam 2) I need help with these
questions Please. WILL GIVE GOOD RATING
1. Wild type blue-eyed mary has blue flowers. Two genes control the pathway that makes the blue pigment: The product of gene W turns a white precursor into magenta pigment. The product of gene M turns the magenta pigment into blue pigment. Each gene has a recessive loss-of-function allele: w and m, respectively. A double heterozygote (Ww Mm) is self-pollinated. What proportion...
 Questions 45-46: Consider the following partial table of a sample of 60 M&Ms. We count how many of each color are present. We are testing the null hypothesis that each color has the stated proportion. Observed Counts Assumed Proportions Expected Counts 0.24 13 14 0.20 10 0.16 Color Blue Orange Green Yellow Red Brown Total 11 0.14 6 0.13 6 0.13 60 1.00 60 45. If the null hypothesis is correct, how many orange M&Ms do we expect to see...
 42. The following StatCrunch output shows the results for a one-sample proportions test. Choose the best interpretation of the p-value.:* One sample Proportion with summary DOX Options Hypothesis test results: p proportion of successes for population Ho p = 0.5 HAD 0.5 Proportion Count Total Sample Prop. Std. Err. P-value 174 0.58 0.028867513 2.7712812 0.0056 Z-Stat p 300 Java Applet Window O a. The probability that the alternative hypothesis is correct. Ob. The probability that we correctly reject the null...
 Match the following terms with the appropriate description
below:
a. alleles b. autosomes c. dominant allele d. genotype e.
heterozygous f. homozygote g. phenotype h. recessive allele i. sex
chromosomes
1. ________________ genetic make-up
2. ________________ how genetic make-up is expressed
3. ________________ chromosomes that dictate most body
characteristics
4. ________________ alternative forms of the same gene
5. ___________an individual bearing two alleles that are the same
for a particular trait 6. ________________ an allele that is
expressed, whether in...
Match the following terms with the appropriate description
below:
a. alleles b. autosomes c. dominant allele d. genotype e.
heterozygous f. homozygote g. phenotype h. recessive allele i. sex
chromosomes
1. ________________ genetic make-up
2. ________________ how genetic make-up is expressed
3. ________________ chromosomes that dictate most body
characteristics
4. ________________ alternative forms of the same gene
5. ___________an individual bearing two alleles that are the same
for a particular trait 6. ________________ an allele that is
expressed, whether in...
 Practice questions for BIO 340 (Exam 2) I need help with these
questions Please. WILL GIVE GOOD RATING
1. Wild type blue-eyed mary has blue flowers. Two genes control the pathway that makes the blue pigment: The product of gene W turns a white precursor into magenta pigment. The product of gene M turns the magenta pigment into blue pigment. Each gene has a recessive loss-of-function allele: w and m, respectively. A double heterozygote (Ww Mm) is self-pollinated. What proportion...
Practice questions for BIO 340 (Exam 2) I need help with these
questions Please. WILL GIVE GOOD RATING
1. Wild type blue-eyed mary has blue flowers. Two genes control the pathway that makes the blue pigment: The product of gene W turns a white precursor into magenta pigment. The product of gene M turns the magenta pigment into blue pigment. Each gene has a recessive loss-of-function allele: w and m, respectively. A double heterozygote (Ww Mm) is self-pollinated. What proportion...
Most questions answered within 3 hours.
-
1. (A) Write two
structural (constitutional)
isomers of C4H8F2?
Please show all of
the
asked 35 seconds ago -
1) Name the three holes located in the greater wing of the
sphenoid bone in order...
asked 59 seconds ago -
For the following reaction set-up, which type of hydrocarbon
product would form? 1,4-hexadiene + two Cl2...
asked 3 minutes ago -
Consider the following method that is intended to determine if
the double values d1 and d2...
asked 15 minutes ago -
could someone please post clear drawings of the three structures
in the equilibrium mixture of D-glucose...
asked 22 minutes ago -
Using the Properties of Order show that 5n5 +
4n4 + 6n3 + 2n2+ n +...
asked 26 minutes ago -
What is experiential learning and how is it helpful for teaching
leadership, and interpreting group dynamics?...
asked 25 minutes ago -
A security awareness policy defines the responsibilities of
managers and information owners.
True
False
asked 27 minutes ago -
which is the equilibrium expression for the reaction
3A(g)+4B(g)<---> 2C(g)+5D(g)
asked 28 minutes ago -
Create a balanced compensation plan that you feel would
encourage a restaurant manager to be more...
asked 35 minutes ago -
Re: Human Physiology
Comment on the differences between representing V02 max as an
absolute number and...
asked 38 minutes ago -
A firm with a WACC of 10% is considering the following mutually
exclusive projects:
0
1...
asked 42 minutes ago