
Homework Answers
Rise in demand of loanable funds will shift its demand curve to its right which raise rate of interest as well as quantity of funds traded as depicted in diagram below.

Aggregate demand = Consumption + Investment + Government spending + Exports - Imports
Investment and Interest rate have negative relationship with each other. Rise in rate of interest will reduces investment level which reduces aggregate demand and shift aggregate demand curve to its left which reduce price as well as quantity traded.
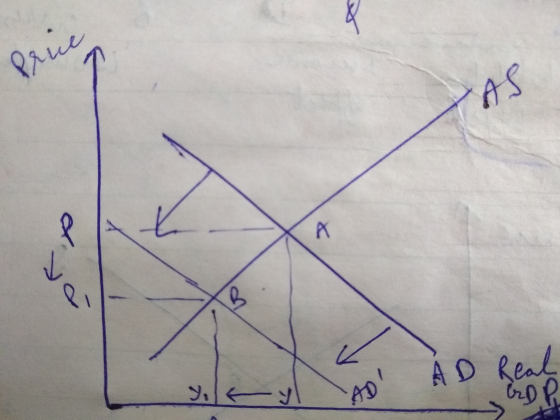
Fall in price raise purchasing power of money as the same money can buy more units.
Add Answer to:
3
graphs one for purchasing power of money one for the price/quantity
and the other one...
please 3 graphs is needed one for purchasing power of money one for price and the...
 please 3 graphs is needed one for purchasing power of money one for
price and the other one for quantity of loanable funds when there
is a decrease in the supply of money and credit please read the
question carefully
Heading 1 Normal No Spacing Heading 2 Title a DA Case 2: Draw the Purchasing Power of Money, the Price/Quantity and the Quantity-of- Loanable Funds graphs for the case of a decreasing supply of money and credit. 1 Focus English...
please 3 graphs is needed one for purchasing power of money one for
price and the other one for quantity of loanable funds when there
is a decrease in the supply of money and credit please read the
question carefully
Heading 1 Normal No Spacing Heading 2 Title a DA Case 2: Draw the Purchasing Power of Money, the Price/Quantity and the Quantity-of- Loanable Funds graphs for the case of a decreasing supply of money and credit. 1 Focus English...
PART II - GRAPHING EXERCISES (First of two exercise questions - each 15 pts. IF YOUR...
 PART II - GRAPHING EXERCISES (First of two exercise questions - each 15 pts. IF YOUR LAST NAME BEGINS WITH LETTERS M THROUGH Z DO CASE 1. IF YOUR LAST NAME BEGINS WITH LETTERS A THROUGH L DO CASE 2. On this examination copy, on the page below, draw the three graphs required to answer the graphing exercise question specified immediately below. Case 1: Draw the Purchasing Power of Money, the Price/Quantity and the Quantity-of- Loanable Funds graphs for the...
Draw the graphs for: The Purchasing Power of Money, the Price/Quantity, and the Quantity-of-Loanable Funds graphs...
Draw the graphs for: The Purchasing Power of Money, the Price/Quantity, and the Quantity-of-Loanable Funds graphs for the case of a decreasing demand of money and credit.
Case 3: Draw the Purchasing Power of Money, the Price/Quantity and the Quantity-of- Loanable Funds graphs...
 Case 3: Draw the Purchasing Power of Money, the Price/Quantity and the Quantity-of- Loanable Funds graphs for the case of an increasing demand of money and credit.
Draw the Purchasing Power of Money, the Price/Quantity and the Quantity-of- Loanable Funds graphs for the...
Draw the Purchasing Power of Money, the Price/Quantity and the Quantity-of- Loanable Funds graphs for the case of an increasing demand of money and credit
GRAPH Case 1: Draw the Purchasing Power of Money, the Price/Quantity and the Quantity-of- Loanable...
GRAPH Case 1: Draw the Purchasing Power of Money, the Price/Quantity and the Quantity-of- Loanable Funds graphs for the case of an increasing supply of money and credit. Case 2: Draw the Purchasing Power of Money, the Price/Quantity and the Quantity-of- Loanable Funds graphs for the case of an increasing demand of money and credit.
Draw Graphs for: the Purchasing Power of Money, the Price/Quantity, and the Quantity-of-Loanable Funds graphs for...
Draw Graphs for: the Purchasing Power of Money, the Price/Quantity, and the Quantity-of-Loanable Funds graphs for the case of a decreasing supply of money and credit.
Case 1: Draw the Purchasing Power of Money, the Price/Quantity and the Quantity-of- Loanable Funds...
Case 1: Draw the Purchasing Power of Money, the Price/Quantity and the Quantity-of- Loanable Funds graphs for the case of an increasing supply of money and credit. Case 2: Draw the Purchasing Power of Money, the Price/Quantity and the Quantity-of- Loanable Funds graphs for the case of a decreasing supply of money and credit.
PLEASE DRAW 3 DIFFERENT GRAPHS FOR THIS QUESTION. THANK YOU. **Case 1: Draw the Purchasing Power...
 PLEASE DRAW 3 DIFFERENT GRAPHS
FOR THIS QUESTION. THANK YOU.
**Case 1: Draw the Purchasing Power of Money, the Price/Quantity and the Quantity-of- Loanable Funds graphs for the case of an increasing supply of money and credit.
PLEASE DRAW 3 DIFFERENT GRAPHS
FOR THIS QUESTION. THANK YOU.
**Case 1: Draw the Purchasing Power of Money, the Price/Quantity and the Quantity-of- Loanable Funds graphs for the case of an increasing supply of money and credit.
draw the purchasing power of money in the case of a decrease in demand for money...
draw the purchasing power of money in the case of a decrease in demand for money and credit (graph)
 please 3 graphs is needed one for purchasing power of money one for
price and the other one for quantity of loanable funds when there
is a decrease in the supply of money and credit please read the
question carefully
Heading 1 Normal No Spacing Heading 2 Title a DA Case 2: Draw the Purchasing Power of Money, the Price/Quantity and the Quantity-of- Loanable Funds graphs for the case of a decreasing supply of money and credit. 1 Focus English...
please 3 graphs is needed one for purchasing power of money one for
price and the other one for quantity of loanable funds when there
is a decrease in the supply of money and credit please read the
question carefully
Heading 1 Normal No Spacing Heading 2 Title a DA Case 2: Draw the Purchasing Power of Money, the Price/Quantity and the Quantity-of- Loanable Funds graphs for the case of a decreasing supply of money and credit. 1 Focus English...
 PART II - GRAPHING EXERCISES (First of two exercise questions - each 15 pts. IF YOUR LAST NAME BEGINS WITH LETTERS M THROUGH Z DO CASE 1. IF YOUR LAST NAME BEGINS WITH LETTERS A THROUGH L DO CASE 2. On this examination copy, on the page below, draw the three graphs required to answer the graphing exercise question specified immediately below. Case 1: Draw the Purchasing Power of Money, the Price/Quantity and the Quantity-of- Loanable Funds graphs for the...
 Case 3: Draw the Purchasing Power of Money, the Price/Quantity and the Quantity-of- Loanable Funds graphs for the case of an increasing demand of money and credit.
 PLEASE DRAW 3 DIFFERENT GRAPHS
FOR THIS QUESTION. THANK YOU.
**Case 1: Draw the Purchasing Power of Money, the Price/Quantity and the Quantity-of- Loanable Funds graphs for the case of an increasing supply of money and credit.
PLEASE DRAW 3 DIFFERENT GRAPHS
FOR THIS QUESTION. THANK YOU.
**Case 1: Draw the Purchasing Power of Money, the Price/Quantity and the Quantity-of- Loanable Funds graphs for the case of an increasing supply of money and credit.
Most questions answered within 3 hours.
-
You are attempting to calculate a firm’s free cash flow to
equity. You know the following...
asked 28 minutes ago -
the following reaction occurs in a balloon containing
N2O2 gas
N2O4(g)=2NO2(g)
will the volume of the...
asked 1 hour ago -
answer the questions throughout this program
public class Day implements Comparable {
Private Boolean atWork;...
asked 1 hour ago -
This is C++ code for parking fee management program
#include <iostream>
#include <iomanip>
using namespace std;...
asked 1 hour ago -
The free energy change for the following reaction at 25 °C, when
[Sn2+] = 1.17 M...
asked 3 hours ago -
An MNE is this kind of industry when competition in one country
is essentially independent of...
asked 4 hours ago -
. For this set of questions, determine what
proportion of a normal distribution is located betweeneach...
asked 5 hours ago -
A college student is employed as a door-to-door newspaper
salesman. Historical data suggests that the student...
asked 6 hours ago -
MATLAB HW 11 problem using Switch Case and Input commands
Write a script file that calculates...
asked 5 hours ago -
Considering gravitational time dilation, calculate the time that
passes in Earth’s surface while 1 hour passes...
asked 6 hours ago -
Minitab Problem: Take the Lake Hume June rainfall data and find
use the processes outlined in...
asked 7 hours ago -
X Company is trying to decide whether to continue using old
equipment to make Product A...
asked 7 hours ago