Draw the graphs for: The Purchasing Power of Money, the Price/Quantity, and the Quantity-of-Loanable Funds graphs...
Homework Answers
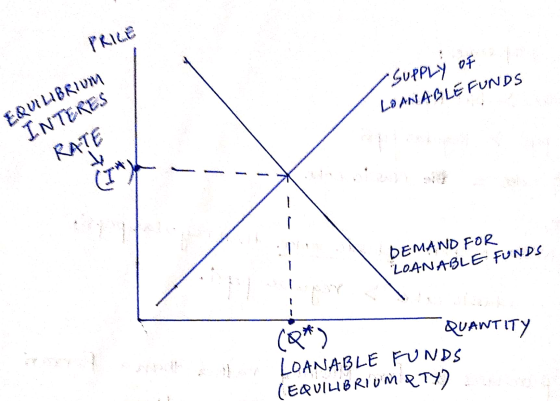
When the quantity of money demanded or loanable funds decreases,
the price of money(or interest rate) also decreases, while shifting
the demand for loanable funds curve to shift to the left, i.e. at
higher interest rates, people will demand less loanable funds, and
at lower interest rates, people will demand more loanable
funds.
Add Answer to:
Draw the graphs for:
The Purchasing Power of Money, the Price/Quantity, and the
Quantity-of-Loanable Funds graphs...
Draw Graphs for: the Purchasing Power of Money, the Price/Quantity, and the Quantity-of-Loanable Funds graphs for...
Draw Graphs for: the Purchasing Power of Money, the Price/Quantity, and the Quantity-of-Loanable Funds graphs for the case of a decreasing supply of money and credit.
Case 1: Draw the Purchasing Power of Money, the Price/Quantity and the Quantity-of- Loanable Funds...
Case 1: Draw the Purchasing Power of Money, the Price/Quantity and the Quantity-of- Loanable Funds graphs for the case of an increasing supply of money and credit. Case 2: Draw the Purchasing Power of Money, the Price/Quantity and the Quantity-of- Loanable Funds graphs for the case of a decreasing supply of money and credit.
Draw the Purchasing Power of Money, the Price/Quantity and the Quantity-of- Loanable Funds graphs for the...
Draw the Purchasing Power of Money, the Price/Quantity and the Quantity-of- Loanable Funds graphs for the case of an increasing demand of money and credit
Case 3: Draw the Purchasing Power of Money, the Price/Quantity and the Quantity-of- Loanable Funds graphs...
 Case 3: Draw the Purchasing Power of Money, the Price/Quantity and the Quantity-of- Loanable Funds graphs for the case of an increasing demand of money and credit.
GRAPH Case 1: Draw the Purchasing Power of Money, the Price/Quantity and the Quantity-of- Loanable...
GRAPH Case 1: Draw the Purchasing Power of Money, the Price/Quantity and the Quantity-of- Loanable Funds graphs for the case of an increasing supply of money and credit. Case 2: Draw the Purchasing Power of Money, the Price/Quantity and the Quantity-of- Loanable Funds graphs for the case of an increasing demand of money and credit.
3 graphs one for purchasing power of money one for the price/quantity and the other one...
 3
graphs one for purchasing power of money one for the price/quantity
and the other one for the quantity of loanable funds
Heading 1 Normal A No Spacing Heading 2 PART II -- GRAPHING EXERCISES (Second of two exercise questions - each 15 pts. IF YOUR LAST NAME BEGINS WITH LETTERS M THROUGH Z DO CASE 3. IF YOUR LAST NAME BEGINS WITH LETTERS A THROUGH L DO CASE 4. On this examination copy, on the page below, draw the...
3
graphs one for purchasing power of money one for the price/quantity
and the other one for the quantity of loanable funds
Heading 1 Normal A No Spacing Heading 2 PART II -- GRAPHING EXERCISES (Second of two exercise questions - each 15 pts. IF YOUR LAST NAME BEGINS WITH LETTERS M THROUGH Z DO CASE 3. IF YOUR LAST NAME BEGINS WITH LETTERS A THROUGH L DO CASE 4. On this examination copy, on the page below, draw the...
please 3 graphs is needed one for purchasing power of money one for price and the...
 please 3 graphs is needed one for purchasing power of money one for
price and the other one for quantity of loanable funds when there
is a decrease in the supply of money and credit please read the
question carefully
Heading 1 Normal No Spacing Heading 2 Title a DA Case 2: Draw the Purchasing Power of Money, the Price/Quantity and the Quantity-of- Loanable Funds graphs for the case of a decreasing supply of money and credit. 1 Focus English...
please 3 graphs is needed one for purchasing power of money one for
price and the other one for quantity of loanable funds when there
is a decrease in the supply of money and credit please read the
question carefully
Heading 1 Normal No Spacing Heading 2 Title a DA Case 2: Draw the Purchasing Power of Money, the Price/Quantity and the Quantity-of- Loanable Funds graphs for the case of a decreasing supply of money and credit. 1 Focus English...
PLEASE DRAW 3 DIFFERENT GRAPHS FOR THIS QUESTION. THANK YOU. **Case 1: Draw the Purchasing Power...
 PLEASE DRAW 3 DIFFERENT GRAPHS
FOR THIS QUESTION. THANK YOU.
**Case 1: Draw the Purchasing Power of Money, the Price/Quantity and the Quantity-of- Loanable Funds graphs for the case of an increasing supply of money and credit.
PLEASE DRAW 3 DIFFERENT GRAPHS
FOR THIS QUESTION. THANK YOU.
**Case 1: Draw the Purchasing Power of Money, the Price/Quantity and the Quantity-of- Loanable Funds graphs for the case of an increasing supply of money and credit.
PART II - GRAPHING EXERCISES (First of two exercise questions - each 15 pts. IF YOUR...
 PART II - GRAPHING EXERCISES (First of two exercise questions - each 15 pts. IF YOUR LAST NAME BEGINS WITH LETTERS M THROUGH Z DO CASE 1. IF YOUR LAST NAME BEGINS WITH LETTERS A THROUGH L DO CASE 2. On this examination copy, on the page below, draw the three graphs required to answer the graphing exercise question specified immediately below. Case 1: Draw the Purchasing Power of Money, the Price/Quantity and the Quantity-of- Loanable Funds graphs for the...
draw the purchasing power of money in the case of a decrease in demand for money...
draw the purchasing power of money in the case of a decrease in demand for money and credit (graph)
 Case 3: Draw the Purchasing Power of Money, the Price/Quantity and the Quantity-of- Loanable Funds graphs for the case of an increasing demand of money and credit.
 3
graphs one for purchasing power of money one for the price/quantity
and the other one for the quantity of loanable funds
Heading 1 Normal A No Spacing Heading 2 PART II -- GRAPHING EXERCISES (Second of two exercise questions - each 15 pts. IF YOUR LAST NAME BEGINS WITH LETTERS M THROUGH Z DO CASE 3. IF YOUR LAST NAME BEGINS WITH LETTERS A THROUGH L DO CASE 4. On this examination copy, on the page below, draw the...
3
graphs one for purchasing power of money one for the price/quantity
and the other one for the quantity of loanable funds
Heading 1 Normal A No Spacing Heading 2 PART II -- GRAPHING EXERCISES (Second of two exercise questions - each 15 pts. IF YOUR LAST NAME BEGINS WITH LETTERS M THROUGH Z DO CASE 3. IF YOUR LAST NAME BEGINS WITH LETTERS A THROUGH L DO CASE 4. On this examination copy, on the page below, draw the...
 please 3 graphs is needed one for purchasing power of money one for
price and the other one for quantity of loanable funds when there
is a decrease in the supply of money and credit please read the
question carefully
Heading 1 Normal No Spacing Heading 2 Title a DA Case 2: Draw the Purchasing Power of Money, the Price/Quantity and the Quantity-of- Loanable Funds graphs for the case of a decreasing supply of money and credit. 1 Focus English...
please 3 graphs is needed one for purchasing power of money one for
price and the other one for quantity of loanable funds when there
is a decrease in the supply of money and credit please read the
question carefully
Heading 1 Normal No Spacing Heading 2 Title a DA Case 2: Draw the Purchasing Power of Money, the Price/Quantity and the Quantity-of- Loanable Funds graphs for the case of a decreasing supply of money and credit. 1 Focus English...
 PLEASE DRAW 3 DIFFERENT GRAPHS
FOR THIS QUESTION. THANK YOU.
**Case 1: Draw the Purchasing Power of Money, the Price/Quantity and the Quantity-of- Loanable Funds graphs for the case of an increasing supply of money and credit.
PLEASE DRAW 3 DIFFERENT GRAPHS
FOR THIS QUESTION. THANK YOU.
**Case 1: Draw the Purchasing Power of Money, the Price/Quantity and the Quantity-of- Loanable Funds graphs for the case of an increasing supply of money and credit.
 PART II - GRAPHING EXERCISES (First of two exercise questions - each 15 pts. IF YOUR LAST NAME BEGINS WITH LETTERS M THROUGH Z DO CASE 1. IF YOUR LAST NAME BEGINS WITH LETTERS A THROUGH L DO CASE 2. On this examination copy, on the page below, draw the three graphs required to answer the graphing exercise question specified immediately below. Case 1: Draw the Purchasing Power of Money, the Price/Quantity and the Quantity-of- Loanable Funds graphs for the...
Most questions answered within 3 hours.
-
Problem #5
A communications cable is 2.00 km long and consists of two
parallel wires separated...
asked 26 minutes ago -
Cranium, Inc., purchases term papers from an overseas supplier
under a continuous review system. The average...
asked 3 hours ago -
1- What is the freezing point of pure water (in degrees
Celsius)?
2-
he molar mass...
asked 4 hours ago -
Determine the direction of the force that will act on the charge
in each of the...
asked 4 hours ago -
You purchase your daily coffee at the Chemist’s Coffeehouse and
have a choice of two cups:...
asked 7 hours ago -
Which of the following pairs of chemicals could be used to make
a buffer solution?
A.)...
asked 6 hours ago -
Problem 16-51 Sales
Activity Variance (LO 16-3)Odessa, Inc., reports the following
information concerning operations for the...
asked 7 hours ago -
Pictured on the right are thee point charges Q1 = 18.4 μC, Q2 =
-30.6 μC,...
asked 7 hours ago -
A graduate student is conducting research in psychology and
needs to obtain the IQ scores of...
asked 8 hours ago -
R2.84: There are 2 defective products in a production lot of 10.
An inspector randomly selected...
asked 9 hours ago -
Consider the following equilibrium system: COCl2(g) CO(g) +
Cl2(g) A 10.00 L evacuated flask is filled...
asked 10 hours ago -
1) What are the two distinct steps that one needs to perform
when developing a data...
asked 10 hours ago