
Homework Answers
1) Rise in supply of loanable funds will shift its supply curve to its right from S to S1 which reduce rate of interest and raise quantity of funds traded as depicted in diagram below.

Aggregate demand = Consumption + Investment + Government spending + Exports - Imports
Investment and Interest rate have negative relationship with each other. Reduced rate of interest will raise investment level which raise aggregate demand and shift aggregate demand curve to its right which raise price as well as quantity traded.
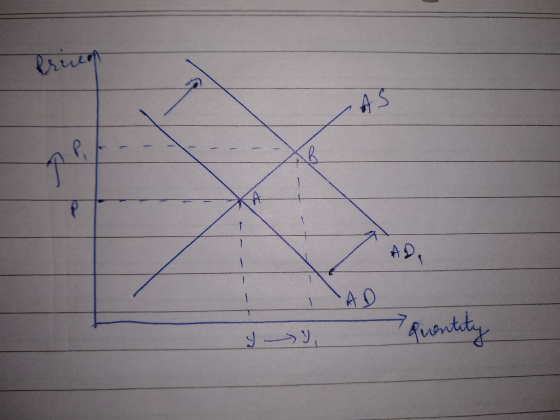
Rise in price will reduce purchasing power of money as same money can buy fewer units.
2) Decrease in supply of money will shift supply of loanable funds to its left which raise rate of interest and reduce quantity of loanable funds.

Aggregate demand = Consumption + Investment + Government spending + Exports - Imports
Investment and Interest rate have negative relationship with each other. Rise in rate of interest will reduce investment level which reduce aggregate demand and shift aggregate demand curve to its left which reduce price as well as quantity traded.

Fall in price will raise purchasing power as same money can buy more units.
Add Answer to:
PART II - GRAPHING EXERCISES (First of two exercise questions - each 15 pts. IF YOUR...
3 graphs one for purchasing power of money one for the price/quantity and the other one...
 3
graphs one for purchasing power of money one for the price/quantity
and the other one for the quantity of loanable funds
Heading 1 Normal A No Spacing Heading 2 PART II -- GRAPHING EXERCISES (Second of two exercise questions - each 15 pts. IF YOUR LAST NAME BEGINS WITH LETTERS M THROUGH Z DO CASE 3. IF YOUR LAST NAME BEGINS WITH LETTERS A THROUGH L DO CASE 4. On this examination copy, on the page below, draw the...
3
graphs one for purchasing power of money one for the price/quantity
and the other one for the quantity of loanable funds
Heading 1 Normal A No Spacing Heading 2 PART II -- GRAPHING EXERCISES (Second of two exercise questions - each 15 pts. IF YOUR LAST NAME BEGINS WITH LETTERS M THROUGH Z DO CASE 3. IF YOUR LAST NAME BEGINS WITH LETTERS A THROUGH L DO CASE 4. On this examination copy, on the page below, draw the...
Case 1: Draw the Purchasing Power of Money, the Price/Quantity and the Quantity-of- Loanable Funds...
Case 1: Draw the Purchasing Power of Money, the Price/Quantity and the Quantity-of- Loanable Funds graphs for the case of an increasing supply of money and credit. Case 2: Draw the Purchasing Power of Money, the Price/Quantity and the Quantity-of- Loanable Funds graphs for the case of a decreasing supply of money and credit.
Draw Graphs for: the Purchasing Power of Money, the Price/Quantity, and the Quantity-of-Loanable Funds graphs for...
Draw Graphs for: the Purchasing Power of Money, the Price/Quantity, and the Quantity-of-Loanable Funds graphs for the case of a decreasing supply of money and credit.
please 3 graphs is needed one for purchasing power of money one for price and the...
 please 3 graphs is needed one for purchasing power of money one for
price and the other one for quantity of loanable funds when there
is a decrease in the supply of money and credit please read the
question carefully
Heading 1 Normal No Spacing Heading 2 Title a DA Case 2: Draw the Purchasing Power of Money, the Price/Quantity and the Quantity-of- Loanable Funds graphs for the case of a decreasing supply of money and credit. 1 Focus English...
please 3 graphs is needed one for purchasing power of money one for
price and the other one for quantity of loanable funds when there
is a decrease in the supply of money and credit please read the
question carefully
Heading 1 Normal No Spacing Heading 2 Title a DA Case 2: Draw the Purchasing Power of Money, the Price/Quantity and the Quantity-of- Loanable Funds graphs for the case of a decreasing supply of money and credit. 1 Focus English...
GRAPH Case 1: Draw the Purchasing Power of Money, the Price/Quantity and the Quantity-of- Loanable...
GRAPH Case 1: Draw the Purchasing Power of Money, the Price/Quantity and the Quantity-of- Loanable Funds graphs for the case of an increasing supply of money and credit. Case 2: Draw the Purchasing Power of Money, the Price/Quantity and the Quantity-of- Loanable Funds graphs for the case of an increasing demand of money and credit.
Draw the graphs for: The Purchasing Power of Money, the Price/Quantity, and the Quantity-of-Loanable Funds graphs...
Draw the graphs for: The Purchasing Power of Money, the Price/Quantity, and the Quantity-of-Loanable Funds graphs for the case of a decreasing demand of money and credit.
PLEASE DRAW 3 DIFFERENT GRAPHS FOR THIS QUESTION. THANK YOU. **Case 1: Draw the Purchasing Power...
 PLEASE DRAW 3 DIFFERENT GRAPHS
FOR THIS QUESTION. THANK YOU.
**Case 1: Draw the Purchasing Power of Money, the Price/Quantity and the Quantity-of- Loanable Funds graphs for the case of an increasing supply of money and credit.
PLEASE DRAW 3 DIFFERENT GRAPHS
FOR THIS QUESTION. THANK YOU.
**Case 1: Draw the Purchasing Power of Money, the Price/Quantity and the Quantity-of- Loanable Funds graphs for the case of an increasing supply of money and credit.
Case 3: Draw the Purchasing Power of Money, the Price/Quantity and the Quantity-of- Loanable Funds graphs...
 Case 3: Draw the Purchasing Power of Money, the Price/Quantity and the Quantity-of- Loanable Funds graphs for the case of an increasing demand of money and credit.
Draw the Purchasing Power of Money, the Price/Quantity and the Quantity-of- Loanable Funds graphs for the...
Draw the Purchasing Power of Money, the Price/Quantity and the Quantity-of- Loanable Funds graphs for the case of an increasing demand of money and credit
Use supply and demand graphs to answer the following two questions. Your submitted response to this...
Use supply and demand graphs to answer the following two questions. Your submitted response to this Discussion Topic does not need to include the graphs, but your response should describe the outcome as indicated by the questions below. However, you should practice drawing the graphs both to help you get the answers, and because in the final exam you will need to be able to graph shifts in supply and/or demand, and explain the outcomes. Question 1. Draw a supply-and-demand graph...
 3
graphs one for purchasing power of money one for the price/quantity
and the other one for the quantity of loanable funds
Heading 1 Normal A No Spacing Heading 2 PART II -- GRAPHING EXERCISES (Second of two exercise questions - each 15 pts. IF YOUR LAST NAME BEGINS WITH LETTERS M THROUGH Z DO CASE 3. IF YOUR LAST NAME BEGINS WITH LETTERS A THROUGH L DO CASE 4. On this examination copy, on the page below, draw the...
3
graphs one for purchasing power of money one for the price/quantity
and the other one for the quantity of loanable funds
Heading 1 Normal A No Spacing Heading 2 PART II -- GRAPHING EXERCISES (Second of two exercise questions - each 15 pts. IF YOUR LAST NAME BEGINS WITH LETTERS M THROUGH Z DO CASE 3. IF YOUR LAST NAME BEGINS WITH LETTERS A THROUGH L DO CASE 4. On this examination copy, on the page below, draw the...
 please 3 graphs is needed one for purchasing power of money one for
price and the other one for quantity of loanable funds when there
is a decrease in the supply of money and credit please read the
question carefully
Heading 1 Normal No Spacing Heading 2 Title a DA Case 2: Draw the Purchasing Power of Money, the Price/Quantity and the Quantity-of- Loanable Funds graphs for the case of a decreasing supply of money and credit. 1 Focus English...
please 3 graphs is needed one for purchasing power of money one for
price and the other one for quantity of loanable funds when there
is a decrease in the supply of money and credit please read the
question carefully
Heading 1 Normal No Spacing Heading 2 Title a DA Case 2: Draw the Purchasing Power of Money, the Price/Quantity and the Quantity-of- Loanable Funds graphs for the case of a decreasing supply of money and credit. 1 Focus English...
 PLEASE DRAW 3 DIFFERENT GRAPHS
FOR THIS QUESTION. THANK YOU.
**Case 1: Draw the Purchasing Power of Money, the Price/Quantity and the Quantity-of- Loanable Funds graphs for the case of an increasing supply of money and credit.
PLEASE DRAW 3 DIFFERENT GRAPHS
FOR THIS QUESTION. THANK YOU.
**Case 1: Draw the Purchasing Power of Money, the Price/Quantity and the Quantity-of- Loanable Funds graphs for the case of an increasing supply of money and credit.
 Case 3: Draw the Purchasing Power of Money, the Price/Quantity and the Quantity-of- Loanable Funds graphs for the case of an increasing demand of money and credit.
Most questions answered within 3 hours.
-
Cranium, Inc., purchases term papers from an overseas supplier
under a continuous review system. The average...
asked 2 hours ago -
1- What is the freezing point of pure water (in degrees
Celsius)?
2-
he molar mass...
asked 3 hours ago -
Determine the direction of the force that will act on the charge
in each of the...
asked 3 hours ago -
You purchase your daily coffee at the Chemist’s Coffeehouse and
have a choice of two cups:...
asked 6 hours ago -
Which of the following pairs of chemicals could be used to make
a buffer solution?
A.)...
asked 6 hours ago -
Problem 16-51 Sales
Activity Variance (LO 16-3)Odessa, Inc., reports the following
information concerning operations for the...
asked 6 hours ago -
Pictured on the right are thee point charges Q1 = 18.4 μC, Q2 =
-30.6 μC,...
asked 6 hours ago -
A graduate student is conducting research in psychology and
needs to obtain the IQ scores of...
asked 7 hours ago -
R2.84: There are 2 defective products in a production lot of 10.
An inspector randomly selected...
asked 8 hours ago -
Consider the following equilibrium system: COCl2(g) CO(g) +
Cl2(g) A 10.00 L evacuated flask is filled...
asked 9 hours ago -
1) What are the two distinct steps that one needs to perform
when developing a data...
asked 9 hours ago -
2) Write a C++ program that uses a class called “Degree” to
obtain the trigonometric
values...
asked 10 hours ago