

Homework Answers
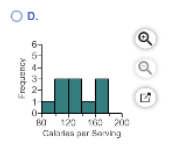
a) Histogram: Answer D.
Normal probability plot:

A. The Randomization Condition is met. The Normal probability plot is relatively straight, but the histogram is bimodal and asymmetric, so the Nearly Normal Condition is not met.
b)
∑x = 1467
∑x² = 203757
n = 11
Mean , x̅ = Ʃx/n = 1467/11 = 133.3636
Standard deviation, s = √[(Ʃx² - (Ʃx)²/n)/(n-1)] = √[(203757-(1467)²/11)/(11-1)] = 28.4825
95% Confidence interval :
At α = 0.05 and df = n-1 = 10, two tailed critical value, t-crit = T.INV.2T(0.05, 10) = 2.228
Lower Bound = x̅ - t-crit*s/√n = 133.3636 - 2.228 * 28.4825/√11 = 114.23
Upper Bound = x̅ + t-crit*s/√n = 133.3636 + 2.228 * 28.4825/√11 = 152.50
114.23 < µ < 152.50
c)
C. The confidence interval contains the diet guide's claim of 140 calories, so this claim is supported by the confidence interval.
Add Answer to:
A company tested 11 random brands of vanilla yogurt and found the number of calories per...
r serving given below. Complete parts a through c below 134 169 141 121 111 110...
 r serving given below. Complete parts a through c below 134 169 141 121 111 110 170 154 119 138 34 act histogram below Q o requency Frequency Frequency 우주 도수 o os equency 2 35 120 160 OD Calories per Serving 888883 Calones por Serving 88888888 Calories per serving 2018 Culories per serving 888888 Hammerce 0 Arc the assumptions and conditions for inference satisfiod? Are the assumptions and conditions for inference satisfied? A. The Randomization Condition is met. The...
A company tested 11 random brands of vanilla yogurt and found the number of calories per...
 A company tested 11 random brands of vanilla yogurt and found the number of calories per serving given below. (Note that more than 110 different brands of vanilla yogurt exist.) Complete parts a through c. 130 160 150 110 110 100 170 150 100 120 100 a) Check the assumptions and conditions for inference Is the Independence Assumption met? O No O Yes Is the Randomization Condition met or is the sample suitably representative? O No O Yes Is the...
A company tested 11 random brands of vanila yogurt and found the number of cal es per ser ng r en...
 A company tested 11 random brands of vanila yogurt and found the number of cal es per ser ng r en elow. Note hat more than 110 ferent brands of vanila yogurt exist Сотр te parts a trou 130 160 140 120 120 110 170 150 120 30 100 a) Chack tha assumptions and conditions far infaranca s the Independence Assumption met? O No s tha Randomization Concition mat or is the sampla sutahly rapresantative? O No O Yes Is...
Shour he Md ErAgscciation One candidate eite neocitecod for e uoer done cocorded every 6 hours. A total of 1114 recigs...
 Shour he Md ErAgscciation One candidate eite neocitecod for e uoer done cocorded every 6 hours. A total of 1114 recigs houd 8.019 moh with a standard dedation of 3 813 mob You bave been asked to make a statistical report to help the landowner decide whether to place a wind turbine at this site. Complete parts a and b below. a) Discuss the assumptions and conditions for using Student's tinference methods with these data. Here are some plots that...
The technology committee at a college has stated that the average time spent by students per...
 The technology committee at a college has stated that the average time spent by students per lab visit has increased, and the increase supports the need for increased lab fees. To substantiate this claim, the committee randomly samples 12 student lab visits and notes the amount of time spent using the computer. The times are given in the accompanying table. Complete parts (a) and (b) below. EClick the icon to view the table of lab times. a) Plot the data....
Question Help n 72 What are the chances your flight will leave on time? To the...
 Question Help n 72 What are the chances your flight will leave on time? To the right are a histogram and summary statistics for the percentage of flights departing on time each month from 2001 thru 2006. There is no evidence of a trend over time. (The correlation of On Time Departure % with time is r=0.017) Complete parts a) through c) below 80.5694 2.72825 of Months 7 6505 OT Departures a) Check the assumptions and conditions for inference Is...
We do not use critical values at all in our course so please avoid using them...
 We do not use critical values at all in our course so please
avoid using them when giving me explanations, as they can cause
confusion on my end between your explanation and what im learning
on my course
here is the link in the paper though it seems the data is
already provided so it might not be required, just posting it in
case you'd like to click on it
https://www.eatthis.com/best-worst-chocolate-chip-cookies/
3. Eat This, Not That! Examined nutrition information for...
We do not use critical values at all in our course so please
avoid using them when giving me explanations, as they can cause
confusion on my end between your explanation and what im learning
on my course
here is the link in the paper though it seems the data is
already provided so it might not be required, just posting it in
case you'd like to click on it
https://www.eatthis.com/best-worst-chocolate-chip-cookies/
3. Eat This, Not That! Examined nutrition information for...
A company that produces cell phones claims its standard phone battery lasts longer on average than...
A company that produces cell phones claims its standard phone battery lasts longer on average than other batteries in the market. To support this claim, the company publishes an ad reporting the results of a recent experiment showing that under normal usage, their batteries last at least 35 hours. To investigate this claim, a consumer advocacy group asked the company for the raw data, which are shown to the right. Find a 95% confidence interval and state your conclusion. Explain...
10. Stock Prices A random sample of stock prices per share (in dollars) is shown. Find...
 10. Stock Prices A random sample of stock prices per share (in dollars) is shown. Find the 90% confidence interval for the variance and standard deviation for the prices. Assume the variable is normally distributed. Chapter 7 Confidence Intervals and Sample Size 404 3. Using Table G. find the values for en and icht a a0.05, n 12 b a 0.10,n-20 a0.05, n27 12.00 28.37 47.50 13.88 7.50 53.81 28.25 10.87 26.69 43.00 75.37 3.81 45.12 13.62 d a0.01,n=6 60.50...
Someone plz plz help with this Statistics Intro to R programming question!!! Here are the examples and follow by my question!! Thank you so much!! I appreciate it !!!!My question!!!! Question T...
 Someone plz plz help with this Statistics Intro to R programming
question!!!
Here are the examples and follow by my question!!
Thank you so much!! I appreciate it
!!!!My question!!!!
Question Type 1: If possible, calculate the 90% confidence intervals for the temperature it takes for crickets to chirp 15 chirps per second. Code (you must copy and paste your code like below in blue color): # Reading in the data Crickets-read.table(C:/Desktop/CricketChirpsvsTemperature.csv', header TRUE, #View Data View Crickets) #Data analysis...
Someone plz plz help with this Statistics Intro to R programming
question!!!
Here are the examples and follow by my question!!
Thank you so much!! I appreciate it
!!!!My question!!!!
Question Type 1: If possible, calculate the 90% confidence intervals for the temperature it takes for crickets to chirp 15 chirps per second. Code (you must copy and paste your code like below in blue color): # Reading in the data Crickets-read.table(C:/Desktop/CricketChirpsvsTemperature.csv', header TRUE, #View Data View Crickets) #Data analysis...
 r serving given below. Complete parts a through c below 134 169 141 121 111 110 170 154 119 138 34 act histogram below Q o requency Frequency Frequency 우주 도수 o os equency 2 35 120 160 OD Calories per Serving 888883 Calones por Serving 88888888 Calories per serving 2018 Culories per serving 888888 Hammerce 0 Arc the assumptions and conditions for inference satisfiod? Are the assumptions and conditions for inference satisfied? A. The Randomization Condition is met. The...
 A company tested 11 random brands of vanilla yogurt and found the number of calories per serving given below. (Note that more than 110 different brands of vanilla yogurt exist.) Complete parts a through c. 130 160 150 110 110 100 170 150 100 120 100 a) Check the assumptions and conditions for inference Is the Independence Assumption met? O No O Yes Is the Randomization Condition met or is the sample suitably representative? O No O Yes Is the...
 A company tested 11 random brands of vanila yogurt and found the number of cal es per ser ng r en elow. Note hat more than 110 ferent brands of vanila yogurt exist Сотр te parts a trou 130 160 140 120 120 110 170 150 120 30 100 a) Chack tha assumptions and conditions far infaranca s the Independence Assumption met? O No s tha Randomization Concition mat or is the sampla sutahly rapresantative? O No O Yes Is...
 Shour he Md ErAgscciation One candidate eite neocitecod for e uoer done cocorded every 6 hours. A total of 1114 recigs houd 8.019 moh with a standard dedation of 3 813 mob You bave been asked to make a statistical report to help the landowner decide whether to place a wind turbine at this site. Complete parts a and b below. a) Discuss the assumptions and conditions for using Student's tinference methods with these data. Here are some plots that...
 The technology committee at a college has stated that the average time spent by students per lab visit has increased, and the increase supports the need for increased lab fees. To substantiate this claim, the committee randomly samples 12 student lab visits and notes the amount of time spent using the computer. The times are given in the accompanying table. Complete parts (a) and (b) below. EClick the icon to view the table of lab times. a) Plot the data....
 Question Help n 72 What are the chances your flight will leave on time? To the right are a histogram and summary statistics for the percentage of flights departing on time each month from 2001 thru 2006. There is no evidence of a trend over time. (The correlation of On Time Departure % with time is r=0.017) Complete parts a) through c) below 80.5694 2.72825 of Months 7 6505 OT Departures a) Check the assumptions and conditions for inference Is...
 We do not use critical values at all in our course so please
avoid using them when giving me explanations, as they can cause
confusion on my end between your explanation and what im learning
on my course
here is the link in the paper though it seems the data is
already provided so it might not be required, just posting it in
case you'd like to click on it
https://www.eatthis.com/best-worst-chocolate-chip-cookies/
3. Eat This, Not That! Examined nutrition information for...
We do not use critical values at all in our course so please
avoid using them when giving me explanations, as they can cause
confusion on my end between your explanation and what im learning
on my course
here is the link in the paper though it seems the data is
already provided so it might not be required, just posting it in
case you'd like to click on it
https://www.eatthis.com/best-worst-chocolate-chip-cookies/
3. Eat This, Not That! Examined nutrition information for...
 10. Stock Prices A random sample of stock prices per share (in dollars) is shown. Find the 90% confidence interval for the variance and standard deviation for the prices. Assume the variable is normally distributed. Chapter 7 Confidence Intervals and Sample Size 404 3. Using Table G. find the values for en and icht a a0.05, n 12 b a 0.10,n-20 a0.05, n27 12.00 28.37 47.50 13.88 7.50 53.81 28.25 10.87 26.69 43.00 75.37 3.81 45.12 13.62 d a0.01,n=6 60.50...
 Someone plz plz help with this Statistics Intro to R programming
question!!!
Here are the examples and follow by my question!!
Thank you so much!! I appreciate it
!!!!My question!!!!
Question Type 1: If possible, calculate the 90% confidence intervals for the temperature it takes for crickets to chirp 15 chirps per second. Code (you must copy and paste your code like below in blue color): # Reading in the data Crickets-read.table(C:/Desktop/CricketChirpsvsTemperature.csv', header TRUE, #View Data View Crickets) #Data analysis...
Someone plz plz help with this Statistics Intro to R programming
question!!!
Here are the examples and follow by my question!!
Thank you so much!! I appreciate it
!!!!My question!!!!
Question Type 1: If possible, calculate the 90% confidence intervals for the temperature it takes for crickets to chirp 15 chirps per second. Code (you must copy and paste your code like below in blue color): # Reading in the data Crickets-read.table(C:/Desktop/CricketChirpsvsTemperature.csv', header TRUE, #View Data View Crickets) #Data analysis...
Most questions answered within 3 hours.
-
Choose the sentence that uses correct punctuation.
1a. The prefatory parts of a report include the...
asked 1 minute ago -
For the element arsenic, which one of the following sets of
quantum numbers could not apply...
asked 11 minutes ago -
Compare and contrast the architectures of 3 types of ADCs:
Flash, SAR, and pipelined. Use the...
asked 12 minutes ago -
Given P(A) = 0.40, P(B) = 0.50, P(A ∩ B) = 0.15. Which of the
following...
asked 16 minutes ago -
Explain changes in workforce participation for women with
children. What legislation exists related to work and...
asked 18 minutes ago -
How high must a pointed arch be if it is to span a
space 4.2 m...
asked 24 minutes ago -
A housepainter who weighs 750 N stands 0.6 m from one end of a
2.0 m...
asked 26 minutes ago -
Implement Singly Linked List detectLoop in Java.
It would check whether the linked list contains a...
asked 29 minutes ago -
A small mailbag is released from a helicopter that is descending
steadily at 2.10 m/s.
After...
asked 29 minutes ago -
Write a C – program that calls a user-defined function from
within main() that determines the...
asked 33 minutes ago -
For a 2-Level design, with 8 factors, a recommended screening
design model is:
a. Taguchi L12...
asked 1 hour ago -
1. Define a function in python that returns the sum of the
following 4 lists. Remember...
asked 1 hour ago