
This is the only info provided on my HW. If you all could please help to the best of your abilities. Thanks!
Homework Answers
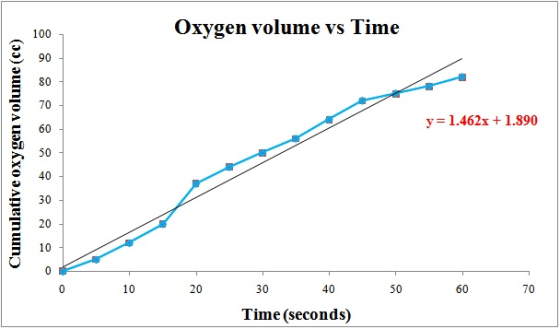
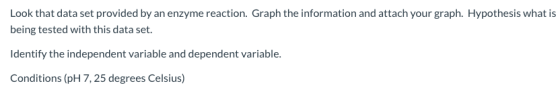
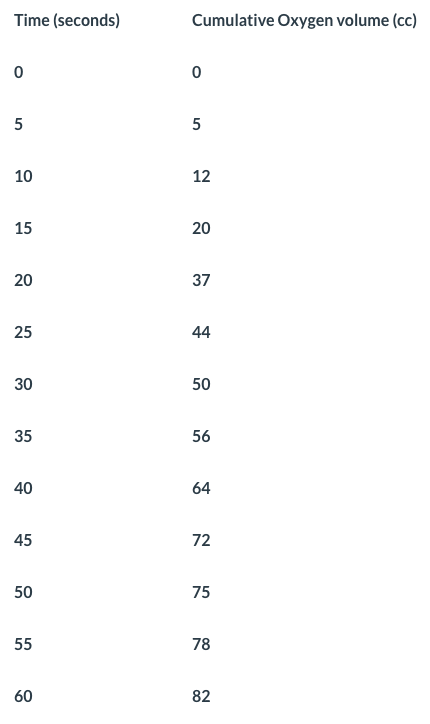
1. The hypothesis which is being tested in the above question is whether the oxygen consumption changes with time.
2. The independent variable is the variable which can be manipulated by the experimenter, can stand alone and it has a direct effect on dependent variable; while dependent variable is the variable whose variations depend on other variable. In the above question "time" is the independent variable and cumulative oxygen consumption is the dependent variable.
3.The equation obtained after plotting the data in excel is y = 1.462 X + 1.890. This equation is similar to the equation of straight line y = mx + c. Here in this equation m is the slope of the line. Therefore the slope of the line calculated from equation is 1.462.
4. The trendline observed in the graph is linear trendline. A linear trendline is a best-fit straight line which is used with simple linear data sets. It usually shows that the data is increasing as can be observed from the graph, the volume of oxygen is increasing with increase in time at a steady rate.
Add Answer to:
This is the only info provided on my HW. If you all could please
help to...
Please answer all questions! thanks :) VI/ Test scores from a math midterm are as follows:...
 Please
answer all questions! thanks :)
VI/ Test scores from a math midterm are as follows: 79, 90, 85, 89, 70, 59, 75, 64, 83, 78, 75, 77, 78, 77, 67, 85, 74, 52, 87, 72, 69, 76, 61, 77, 93, 86, 79, 90, 74, 67, 51, 75, 77, 82, 78, 60, 86, 72, 91, 95, 82 Complete the frequency distribution table to include all data a. Class Tallies Class Midpoint Relative Cumulative Frequency relative freq boundaries Frequency 51 57...
Please
answer all questions! thanks :)
VI/ Test scores from a math midterm are as follows: 79, 90, 85, 89, 70, 59, 75, 64, 83, 78, 75, 77, 78, 77, 67, 85, 74, 52, 87, 72, 69, 76, 61, 77, 93, 86, 79, 90, 74, 67, 51, 75, 77, 82, 78, 60, 86, 72, 91, 95, 82 Complete the frequency distribution table to include all data a. Class Tallies Class Midpoint Relative Cumulative Frequency relative freq boundaries Frequency 51 57...
Problem 4: Variables that may affect Grades The data set contains a random sample of STAT 250 Final Exam Scores out of 80 points. For each individual sampled, the time (in hours per week) that the stu...
Problem 4: Variables that may affect Grades The data set contains a random sample of STAT 250 Final Exam Scores out of 80 points. For each individual sampled, the time (in hours per week) that the student spent participating in a GMU club or sport and working for pay outside of GMU was recorded. Values of 0 indicate the students either does not participate in a club or sport or does not work a job for pay. The goal of...
Answer only questions 2, 5 and 7 please . Already provided the minitab graphs to help...
 Answer only questions 2, 5 and
7 please . Already provided the minitab graphs to help answers
questions 2,5 and 7
DSCI 346-01 F18: Chapter 12 On-Paper Assignment (40 points) Begin by re-writing the problem. Minitab is required; attach or include your output. Type your assignment (use Word); you may handwrite equations. You may want to refer to the Minitab handouts for Chapter 12 which may be found on Canvas under Chapter 12 Handouts under Modules. Use Data Set G,...
Answer only questions 2, 5 and
7 please . Already provided the minitab graphs to help answers
questions 2,5 and 7
DSCI 346-01 F18: Chapter 12 On-Paper Assignment (40 points) Begin by re-writing the problem. Minitab is required; attach or include your output. Type your assignment (use Word); you may handwrite equations. You may want to refer to the Minitab handouts for Chapter 12 which may be found on Canvas under Chapter 12 Handouts under Modules. Use Data Set G,...
I literally have no idea what I’m doing. Help!!! Please show work!! Write an essay using...
 I literally have no idea what I’m doing. Help!!! Please show
work!!
Write an essay using Word and post it as an attachment to the discussion. Cover the following points. Choose a data set from Stat Disk using one of the following files from 13th Edition Elementary Statistics: Oscar Winner Freshman 15 Word Count Garbage Weights Passive and Active Smoke If the file contains more than one variable, choose a quantitative variable. Create a histogram using your chosen variable and...
I literally have no idea what I’m doing. Help!!! Please show
work!!
Write an essay using Word and post it as an attachment to the discussion. Cover the following points. Choose a data set from Stat Disk using one of the following files from 13th Edition Elementary Statistics: Oscar Winner Freshman 15 Word Count Garbage Weights Passive and Active Smoke If the file contains more than one variable, choose a quantitative variable. Create a histogram using your chosen variable and...
As you can see I'm only missing a couple things on my answers please help! just...
 As you can see I'm only missing a couple things on my answers
please help! just on the last two and by the way I tried 10.60 and
10.607 as well as rounding those numbers but it doesn't seem to be
the right answer. for #2 I tried 0.939 the answer is not
correct.
Yes as the number of assemblers increases . so does the production c. Compute the correlation coefficient. (Negative amounts should be indicated by a minus sign....
As you can see I'm only missing a couple things on my answers
please help! just on the last two and by the way I tried 10.60 and
10.607 as well as rounding those numbers but it doesn't seem to be
the right answer. for #2 I tried 0.939 the answer is not
correct.
Yes as the number of assemblers increases . so does the production c. Compute the correlation coefficient. (Negative amounts should be indicated by a minus sign....
Please I need the answers for question 6 and 7 : 6. Elementary school teachers are...
 Please I need the answers for question 6 and 7 :
6. Elementary school teachers are concerned about "screen time for children. Specifically, they worry that too much time with television, computers, pads, and smart phones is interfering with reading ability. They decide to do a statistical study. They randomly choose some elementary school children from their district, and interview them and their families to determine the amount screen time, on average, per week, for each child. They also record...
Please I need the answers for question 6 and 7 :
6. Elementary school teachers are concerned about "screen time for children. Specifically, they worry that too much time with television, computers, pads, and smart phones is interfering with reading ability. They decide to do a statistical study. They randomly choose some elementary school children from their district, and interview them and their families to determine the amount screen time, on average, per week, for each child. They also record...
can i please get help on identifying my unknown and answering the questions for each part....
 can
i please get help on identifying my unknown and answering the
questions for each part. and please explain because i will be given
an exam like this and want to really understand.
n 122240 2019 (GMT-04 00h 94 92 90 88 86 84 82 80 78 76 74 72 70 68 66 64 1000 1500 2000 2500 3000 3500 4000 Wavenumbers (cm-1) Date: Tue Jun 11 12:22:40 2019 (GMT-04:00kaoutar elbar Scans: 8 Resolution: 4.000 onemea1% RH 003 Q1L 129...
can
i please get help on identifying my unknown and answering the
questions for each part. and please explain because i will be given
an exam like this and want to really understand.
n 122240 2019 (GMT-04 00h 94 92 90 88 86 84 82 80 78 76 74 72 70 68 66 64 1000 1500 2000 2500 3000 3500 4000 Wavenumbers (cm-1) Date: Tue Jun 11 12:22:40 2019 (GMT-04:00kaoutar elbar Scans: 8 Resolution: 4.000 onemea1% RH 003 Q1L 129...
Could you please help me with questions 1a-1b please? ( since i could only find the formula neede...
 Could you please help me with questions 1a-1b please? ( since i
could only find the formula needed for 1a, if u aren't sure with 1b
u can just do 1a but please dont reply "no enough data given "
because i have a lil systemical problem with replying the comments)
* the first question was asked to complete the anova table (
table 9.1 in the picture ) by using the formulas ( in the
pictures)
* I have...
Could you please help me with questions 1a-1b please? ( since i
could only find the formula needed for 1a, if u aren't sure with 1b
u can just do 1a but please dont reply "no enough data given "
because i have a lil systemical problem with replying the comments)
* the first question was asked to complete the anova table (
table 9.1 in the picture ) by using the formulas ( in the
pictures)
* I have...
python program do not use dictionary, list only Complete the program found in assignment4.py. You may...
python program do not use dictionary, list only Complete the program found in assignment4.py. You may not change any provided code. You may only complete the sections labeled: #YOUR CODE HERE Write a program that does the following. Reads the contents of Text from the include file, input.txt Create a dictionary of key-value pairs called index.txt Key: This represents the individual word Value: This is a list of the line number from Text where Key appeared Example: If the word...
Please help with problem 8-56 and 8-57. Thank you!!! 8-56 106 Assume you are planning the...
 Please help with problem 8-56 and 8-57. Thank
you!!!
8-56 106 Assume you are planning the confirmation of accounts receivable. There are 2,000 customer accounts with a total book! value of $5,643,200. Tolerable misstatement is set at $200,000, and expected misstatement is $40,000. The risk of incorrect accep- tance is 30%. The ratio of expected to tolerable misstatement is 20%, and the ratio of tolerable misstatement to the population is 3.5% (round down to 3% for use in Exhibit 8.7)...
Please help with problem 8-56 and 8-57. Thank
you!!!
8-56 106 Assume you are planning the confirmation of accounts receivable. There are 2,000 customer accounts with a total book! value of $5,643,200. Tolerable misstatement is set at $200,000, and expected misstatement is $40,000. The risk of incorrect accep- tance is 30%. The ratio of expected to tolerable misstatement is 20%, and the ratio of tolerable misstatement to the population is 3.5% (round down to 3% for use in Exhibit 8.7)...
 Please
answer all questions! thanks :)
VI/ Test scores from a math midterm are as follows: 79, 90, 85, 89, 70, 59, 75, 64, 83, 78, 75, 77, 78, 77, 67, 85, 74, 52, 87, 72, 69, 76, 61, 77, 93, 86, 79, 90, 74, 67, 51, 75, 77, 82, 78, 60, 86, 72, 91, 95, 82 Complete the frequency distribution table to include all data a. Class Tallies Class Midpoint Relative Cumulative Frequency relative freq boundaries Frequency 51 57...
Please
answer all questions! thanks :)
VI/ Test scores from a math midterm are as follows: 79, 90, 85, 89, 70, 59, 75, 64, 83, 78, 75, 77, 78, 77, 67, 85, 74, 52, 87, 72, 69, 76, 61, 77, 93, 86, 79, 90, 74, 67, 51, 75, 77, 82, 78, 60, 86, 72, 91, 95, 82 Complete the frequency distribution table to include all data a. Class Tallies Class Midpoint Relative Cumulative Frequency relative freq boundaries Frequency 51 57...
 Answer only questions 2, 5 and
7 please . Already provided the minitab graphs to help answers
questions 2,5 and 7
DSCI 346-01 F18: Chapter 12 On-Paper Assignment (40 points) Begin by re-writing the problem. Minitab is required; attach or include your output. Type your assignment (use Word); you may handwrite equations. You may want to refer to the Minitab handouts for Chapter 12 which may be found on Canvas under Chapter 12 Handouts under Modules. Use Data Set G,...
Answer only questions 2, 5 and
7 please . Already provided the minitab graphs to help answers
questions 2,5 and 7
DSCI 346-01 F18: Chapter 12 On-Paper Assignment (40 points) Begin by re-writing the problem. Minitab is required; attach or include your output. Type your assignment (use Word); you may handwrite equations. You may want to refer to the Minitab handouts for Chapter 12 which may be found on Canvas under Chapter 12 Handouts under Modules. Use Data Set G,...
 I literally have no idea what I’m doing. Help!!! Please show
work!!
Write an essay using Word and post it as an attachment to the discussion. Cover the following points. Choose a data set from Stat Disk using one of the following files from 13th Edition Elementary Statistics: Oscar Winner Freshman 15 Word Count Garbage Weights Passive and Active Smoke If the file contains more than one variable, choose a quantitative variable. Create a histogram using your chosen variable and...
I literally have no idea what I’m doing. Help!!! Please show
work!!
Write an essay using Word and post it as an attachment to the discussion. Cover the following points. Choose a data set from Stat Disk using one of the following files from 13th Edition Elementary Statistics: Oscar Winner Freshman 15 Word Count Garbage Weights Passive and Active Smoke If the file contains more than one variable, choose a quantitative variable. Create a histogram using your chosen variable and...
 As you can see I'm only missing a couple things on my answers
please help! just on the last two and by the way I tried 10.60 and
10.607 as well as rounding those numbers but it doesn't seem to be
the right answer. for #2 I tried 0.939 the answer is not
correct.
Yes as the number of assemblers increases . so does the production c. Compute the correlation coefficient. (Negative amounts should be indicated by a minus sign....
As you can see I'm only missing a couple things on my answers
please help! just on the last two and by the way I tried 10.60 and
10.607 as well as rounding those numbers but it doesn't seem to be
the right answer. for #2 I tried 0.939 the answer is not
correct.
Yes as the number of assemblers increases . so does the production c. Compute the correlation coefficient. (Negative amounts should be indicated by a minus sign....
 Please I need the answers for question 6 and 7 :
6. Elementary school teachers are concerned about "screen time for children. Specifically, they worry that too much time with television, computers, pads, and smart phones is interfering with reading ability. They decide to do a statistical study. They randomly choose some elementary school children from their district, and interview them and their families to determine the amount screen time, on average, per week, for each child. They also record...
Please I need the answers for question 6 and 7 :
6. Elementary school teachers are concerned about "screen time for children. Specifically, they worry that too much time with television, computers, pads, and smart phones is interfering with reading ability. They decide to do a statistical study. They randomly choose some elementary school children from their district, and interview them and their families to determine the amount screen time, on average, per week, for each child. They also record...
 can
i please get help on identifying my unknown and answering the
questions for each part. and please explain because i will be given
an exam like this and want to really understand.
n 122240 2019 (GMT-04 00h 94 92 90 88 86 84 82 80 78 76 74 72 70 68 66 64 1000 1500 2000 2500 3000 3500 4000 Wavenumbers (cm-1) Date: Tue Jun 11 12:22:40 2019 (GMT-04:00kaoutar elbar Scans: 8 Resolution: 4.000 onemea1% RH 003 Q1L 129...
can
i please get help on identifying my unknown and answering the
questions for each part. and please explain because i will be given
an exam like this and want to really understand.
n 122240 2019 (GMT-04 00h 94 92 90 88 86 84 82 80 78 76 74 72 70 68 66 64 1000 1500 2000 2500 3000 3500 4000 Wavenumbers (cm-1) Date: Tue Jun 11 12:22:40 2019 (GMT-04:00kaoutar elbar Scans: 8 Resolution: 4.000 onemea1% RH 003 Q1L 129...
 Could you please help me with questions 1a-1b please? ( since i
could only find the formula needed for 1a, if u aren't sure with 1b
u can just do 1a but please dont reply "no enough data given "
because i have a lil systemical problem with replying the comments)
* the first question was asked to complete the anova table (
table 9.1 in the picture ) by using the formulas ( in the
pictures)
* I have...
Could you please help me with questions 1a-1b please? ( since i
could only find the formula needed for 1a, if u aren't sure with 1b
u can just do 1a but please dont reply "no enough data given "
because i have a lil systemical problem with replying the comments)
* the first question was asked to complete the anova table (
table 9.1 in the picture ) by using the formulas ( in the
pictures)
* I have...
 Please help with problem 8-56 and 8-57. Thank
you!!!
8-56 106 Assume you are planning the confirmation of accounts receivable. There are 2,000 customer accounts with a total book! value of $5,643,200. Tolerable misstatement is set at $200,000, and expected misstatement is $40,000. The risk of incorrect accep- tance is 30%. The ratio of expected to tolerable misstatement is 20%, and the ratio of tolerable misstatement to the population is 3.5% (round down to 3% for use in Exhibit 8.7)...
Please help with problem 8-56 and 8-57. Thank
you!!!
8-56 106 Assume you are planning the confirmation of accounts receivable. There are 2,000 customer accounts with a total book! value of $5,643,200. Tolerable misstatement is set at $200,000, and expected misstatement is $40,000. The risk of incorrect accep- tance is 30%. The ratio of expected to tolerable misstatement is 20%, and the ratio of tolerable misstatement to the population is 3.5% (round down to 3% for use in Exhibit 8.7)...
Most questions answered within 3 hours.
-
To be done in java code. 2 words are anagrams if 1 word can be
formed...
asked 4 minutes ago -
Bright Sun, Inc. sold an issue of 30-year $1,000 par value bonds
to the public. The...
asked 1 minute ago -
Two players take turns at removing 1 to 4 coins from an original
pile of 16...
asked 21 seconds ago -
The income statement for the month of June, 2014 of Happy Smiles
Enterprises contains the following...
asked 6 minutes ago -
1-Calculate the mass in grams of 2.55 moles of KCl
2- Calculate how many moles are...
asked 6 minutes ago -
1. Choose value for p between 0.20 and 0.80. It should have at
least two decimal...
asked 8 minutes ago -
QUESTIONS: 500 words for the question
In defining abnormality, the criteria of “deviance”, “distress”
and “dysfunction”...
asked 9 minutes ago -
A sample of n = 25 scores produces a t statistic of t =
-2.062. If...
asked 27 minutes ago -
Given the following, compute the after tax cost of debt: The par
value of the firms...
asked 21 minutes ago -
Coding in C. Please only use stdio.h (which would mean no malloc
or anything like that)...
asked 26 minutes ago -
Use the fundamental accounting equation to find the missing
amounts.
Scenario
Assets
Liabilities
Equity
1
$...
asked 24 minutes ago -
A population has a mean of 200 and a standard deviation of 60.
Suppose a sample...
asked 28 minutes ago