


 l
l


Homework Answers
Add Answer to:
l
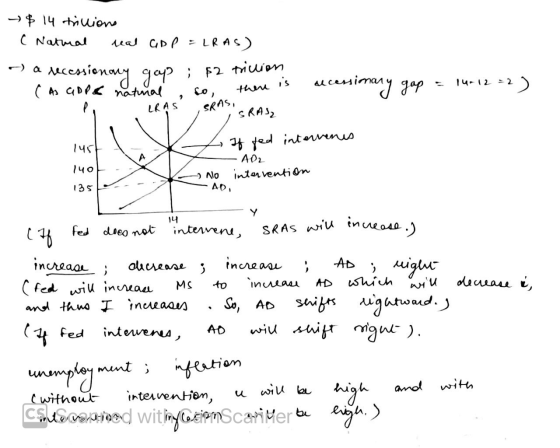
6. Monetary policy and the problem of inflationary and recessionary gaps On the following graph,...
1. GDP is _____ 11 trillion/ 16 trillion/ 10 trillion / 14 trillion /12 trillion 2. currently...
 1. GDP is _____ 11
trillion/ 16 trillion/ 10 trillion / 14 trillion /12
trillion
2. currently _____ recessionary gap / inflationary
gap
3. of ______ 4 trillion / 1 trillion / 5 trillion / 2
trillion / 3 trillion
4. the Fed will ____ increase / decrease
5. which will _____ increase/ decrease
6. incentive to ____ increase / decrease
7. shifting the ____ AD / SRAS / LRAS
8. curve to the ____ left / right
9. relatively high...
1. GDP is _____ 11
trillion/ 16 trillion/ 10 trillion / 14 trillion /12
trillion
2. currently _____ recessionary gap / inflationary
gap
3. of ______ 4 trillion / 1 trillion / 5 trillion / 2
trillion / 3 trillion
4. the Fed will ____ increase / decrease
5. which will _____ increase/ decrease
6. incentive to ____ increase / decrease
7. shifting the ____ AD / SRAS / LRAS
8. curve to the ____ left / right
9. relatively high...
Aa Aa 4. The effect of Bank of Canada action (or inaction) in the AD-AS model Consider the follow...
 Aa Aa 4. The effect of Bank of Canada action (or inaction) in the AD-AS model Consider the following graph. The economy is currently producing at point A (grey star symbol), which corresponds to the intersection of the AD1 and SRAS1 curves. The Bank of Canada is considering whether to intervene in an effort to bring the economy back to its potential PRICE LEVEL 180 LRAS SRAS 175 If Bank Intervenes 170 SRAS1 165 160 155 150 AD2 145 140...
The following graph represents the money market in ahypothetical economy. As in the United States,...
 The following graph represents the money market in a
hypothetical economy. As in the United States, this economy has a
central bank called the Fed, but unlike in the United States, the
economy is closed (that is, the economy does not interact with
other economies in the world). The money market is currently in
equilibrium at an interest rate of 4% and a quantity of money equal
to $0.4 trillion, as indicated by the grey star.? Suppose the Fed announces that...
The following graph represents the money market in a
hypothetical economy. As in the United States, this economy has a
central bank called the Fed, but unlike in the United States, the
economy is closed (that is, the economy does not interact with
other economies in the world). The money market is currently in
equilibrium at an interest rate of 4% and a quantity of money equal
to $0.4 trillion, as indicated by the grey star.? Suppose the Fed announces that...
The following graph represents the money market in a hypothetical economy.
 Changes in the money supply The following graph represents the money market in a hypothetical economy. As in the United States, this economy has a central bank called the Fede but unlike in the United States, the economy is closed that is, the economy does not interact with other economies in the world). The money market Currently in equilibrium at an interest rate of 4.5% and a quantity of money equal to $ 0.4 trillion, as indicated by the grey star.Suppose...
2. Changes in the money supply The following graph represents the money market in a hypothetical...
 2. Changes in the money supply The following graph represents the money market in a hypothetical economy. As in the United States, this economy has a central bank called the Fed, but unlike in the United States, the economy is closed (that is, the economy does not interact with other economies in the world). The money market is currently in equilibrium at an interest rate of 6% and a quantity of money equal to $0.4 trillion, as indicated by the grey...
6. The long-run effects of monetary policy Aa Aa The following graphs show an economy that is cur...
 6. The long-run effects of monetary policy The following graphs show an economy that is currently in long-run equilibrium. The first graph shows the aggregate demand (AD) and long-run aggregate supply (LRAS) curves. The second shows the long-run (LR) and short-run (SR) Phillips curves. The point on each graph shows the economy's current position. According to the graphs, potential output in this economy is _______ and the natural rate of unemployment is _______ .Suppose the central bank of the economy decreases the...
Should the government use monetary and fiscal policy in an effort to stabilize the economy?
 7. Use of discretionary policy to stabilize the economy Should the government use monetary and fiscal policy in an effort to stabilize the economy? The following questions address the issue of how monetary and fiscal policies affect the economy, and the pros and cons of using these tools to combat economic fluctuations. The following graph shows a hypothetical aggregate demand curve (AD), short-run aggregate supply curve (AS), and long-run aggregate supply curve (LRAS) for the U.S. economy in April 2020. Suppose the government...
1. Using the monetary policy tool the Fed employs most often, the Fed closes an inflationary...
1. Using the monetary policy tool the Fed employs most often, the Fed closes an inflationary gap. Describe the steps the economy goes through to move to the new equilibrium output and price level. Use graphs with your answer and be sure to label everything completely. 2.Explain and show on a graph the short-run and long-run equilibrium changes in the AD/AS model from expansionary monetary policy. How does this support an anti-monetary policy stance? 3. What is the equation of...
The following graph shows the money market in a hypothetical economy.
 The following graph shows the money market in a hypothetical economy. The central bank in this economy is called the Fed. Assume that the Fed fixes the quantity of money supplied. Suppose the price level decreases from 90 to 75. Shift the appropriate curve on the graph to show the impact of a decrease in the overall price level on the market for money. After the decrease in the price level, the quantity of money demanded at the initial interest rate of 9%...
Help with graph, fill in the blanks and drop downs.Drop Downs:1. more/less2. higher/lower...
 Help with graph, fill in the blanks and drop downs.Drop Downs:1. more/less2. higher/lower3. (short-run change in output):no change/decrease/increase4. (long-run change in price level):same/lower/higher than/as initial expectations5. (long-run change in output):no change/decrease/increase4. The rational expectations model Suppose the U.S. economy is in equilibrium at a potential output of $10 trillion so that unemployment is at the natural rate. At the beginning of the year, the Federal Reserve announces that its monetary policy will aim to maintain output at potential output and sustain...
 1. GDP is _____ 11
trillion/ 16 trillion/ 10 trillion / 14 trillion /12
trillion
2. currently _____ recessionary gap / inflationary
gap
3. of ______ 4 trillion / 1 trillion / 5 trillion / 2
trillion / 3 trillion
4. the Fed will ____ increase / decrease
5. which will _____ increase/ decrease
6. incentive to ____ increase / decrease
7. shifting the ____ AD / SRAS / LRAS
8. curve to the ____ left / right
9. relatively high...
1. GDP is _____ 11
trillion/ 16 trillion/ 10 trillion / 14 trillion /12
trillion
2. currently _____ recessionary gap / inflationary
gap
3. of ______ 4 trillion / 1 trillion / 5 trillion / 2
trillion / 3 trillion
4. the Fed will ____ increase / decrease
5. which will _____ increase/ decrease
6. incentive to ____ increase / decrease
7. shifting the ____ AD / SRAS / LRAS
8. curve to the ____ left / right
9. relatively high...
 Aa Aa 4. The effect of Bank of Canada action (or inaction) in the AD-AS model Consider the following graph. The economy is currently producing at point A (grey star symbol), which corresponds to the intersection of the AD1 and SRAS1 curves. The Bank of Canada is considering whether to intervene in an effort to bring the economy back to its potential PRICE LEVEL 180 LRAS SRAS 175 If Bank Intervenes 170 SRAS1 165 160 155 150 AD2 145 140...
 The following graph represents the money market in a
hypothetical economy. As in the United States, this economy has a
central bank called the Fed, but unlike in the United States, the
economy is closed (that is, the economy does not interact with
other economies in the world). The money market is currently in
equilibrium at an interest rate of 4% and a quantity of money equal
to $0.4 trillion, as indicated by the grey star.? Suppose the Fed announces that...
The following graph represents the money market in a
hypothetical economy. As in the United States, this economy has a
central bank called the Fed, but unlike in the United States, the
economy is closed (that is, the economy does not interact with
other economies in the world). The money market is currently in
equilibrium at an interest rate of 4% and a quantity of money equal
to $0.4 trillion, as indicated by the grey star.? Suppose the Fed announces that...
 Help with graph, fill in the blanks and drop downs.Drop Downs:1. more/less2. higher/lower3. (short-run change in output):no change/decrease/increase4. (long-run change in price level):same/lower/higher than/as initial expectations5. (long-run change in output):no change/decrease/increase4. The rational expectations model Suppose the U.S. economy is in equilibrium at a potential output of $10 trillion so that unemployment is at the natural rate. At the beginning of the year, the Federal Reserve announces that its monetary policy will aim to maintain output at potential output and sustain...
Most questions answered within 3 hours.
-
BA Corp is issuing a 10-year bond with a coupon rate of 6.00
percent. The interest...
asked 6 minutes ago -
How does a cell control the cell cycle? Explain 4 different ways
that cell cycle is...
asked 11 minutes ago -
We have to write some code to simulate
rabbits population growth in Australia. We have determined...
asked 11 minutes ago -
Presidential Aviation has provided charter flights to a wide
array of customers, including business travelers worldwide....
asked 25 minutes ago -
Discuss the significance of accounting systems in generating
reliable accounting information (200 words)
asked 30 minutes ago -
McCracken Aerial,
Inc., produces and sells a unique type of TV antenna. The company
has just...
asked 44 minutes ago -
Write a program to prompt the user for hours and rate per hour
using input to...
asked 1 hour ago -
Hi, please help
1)Draw two molecules that could hydrogen bond with each other.
Draw and indicate...
asked 1 hour ago -
Using Java, I created 3 files, Pizza,PizzaOrder, and
PizzaOrder_Demo that I attached down below. But I...
asked 1 hour ago -
a. An 8-bit successive approximation ADC has a reference voltage
of 10 V. Calculate the resolution...
asked 1 hour ago -
The distance between the two hydrogen nuclei in the H2 molecule
is 110 pm (picometer). How...
asked 1 hour ago -
write an article about drone effect on
construction safety.
asked 1 hour ago