1. Using the monetary policy tool the Fed employs most often, the Fed closes an inflationary...
1. Using the monetary policy tool the Fed employs most often, the Fed closes an inflationary gap. Describe the steps the economy goes through to move to the new equilibrium output and price level. Use graphs with your answer and be sure to label everything completely.
2.Explain and show on a graph the short-run and long-run equilibrium changes in the AD/AS model from expansionary monetary policy. How does this support an anti-monetary policy stance?
3. What is the equation of exchange? Explain.
Homework Answers
(1)
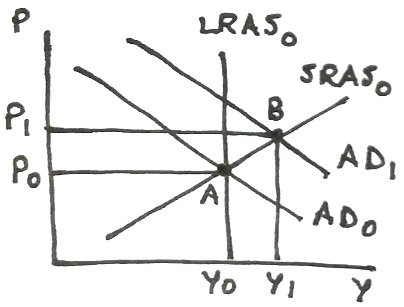
An inflationary gap exists when aggregate demand is so high than real GDP exceeds potential GDP, leading to high inflation. Fed can close the inflationary gap with contractionary monetary policy by decreasing money supply by open market sale of federal securities. When money supply decreases, interest rate increases which decreases investment and decreases the portion of consumption demand funded by borrowing. As a result, aggregate demand falls, shifting AD curve leftward, lowering price level and real GDP.
In following graph, during inflationary period, the economy is at point B where aggregate demand (AD1) intersects short-run aggregate supply curve (SRAS0) to the right of long-run aggregate supply curve (LRAS0) with price level P1 and real GDP Y1, creating an inflationary gap equal to (Y1 - Y0). When Fed lowers money supply, aggregate demand falls, shifting AD1 leftward to AD0 where it intersects SRAS0 and LRAS0 at point A with lower price level P0 and restoring real GDP to potential GDP of Y0, eliminating inflationary gap.
NOTE: As per Answering Policy, 1st question is answered.
Add Answer to:
1. Using the monetary policy tool the Fed employs most often,
the Fed closes an inflationary...
the economy is experiencing a recession and high unemployment a. Use an AD-AS model together with the Fed Funds market to represent ther short ran equilibrium in b. What types of monetary policy...
 the economy is experiencing a recession and high unemployment a. Use an AD-AS model together with the Fed Funds market to represent ther short ran equilibrium in b. What types of monetary policy (i.e.. expansionary or restrictive) should the Fed implement? c. In implementing the policy you suggest. which actions (please give at least two actions) should the Fed take to achieve this policy? Explain how t he y policy would address this problem and the consequence of the monetar...
l 6. Monetary policy and the problem of inflationary and recessionary gaps On the following graph,...
 l
6. Monetary policy and the problem of inflationary and recessionary gaps On the following graph, the economy is producing at point A (grey star symbol), which corresponds to the intersection of the AD, and SRAS curves. The Federal Reserve ("the Fed") is considering whether to intervene in an effort to bring the economy back to its potential. ? LRAS SRAS, 165 160 No Intervention SRAS2 155 150 If Fed Intervenes PRICE LEVEL 145 140 AD2 135 ADA 130 125...
l
6. Monetary policy and the problem of inflationary and recessionary gaps On the following graph, the economy is producing at point A (grey star symbol), which corresponds to the intersection of the AD, and SRAS curves. The Federal Reserve ("the Fed") is considering whether to intervene in an effort to bring the economy back to its potential. ? LRAS SRAS, 165 160 No Intervention SRAS2 155 150 If Fed Intervenes PRICE LEVEL 145 140 AD2 135 ADA 130 125...
2001, the Fed pursued an expansionary monetary policy and reduced interest rates. At the same time, President Georg...
 2001, the Fed pursued an expansionary monetary policy and reduced interest rates. At the same time, President George W. Bush pushed through legislation that lowered Income taxes. "he accompanying IS-LM diagram describes the situation prior to any such policy changes. Initially the economy is at equilibrium point A. .) Using the line drawing tool, draw a new LM curve to illustrate the effect of an expansionary monetary policy. Property abel your curve. 2.) Using the 3-point curve drawing tool, draw...
2) In 2001, the Fed pursued a very expansionary monetary policy. At the sametime, President George...
 2) In 2001, the Fed pursued a very expansionary monetary policy. At the sametime, President George W. Bush pushed through legislation that lowered income taxes. a. Use the IS-LM diagram to describe the situation prior to any such policy changes labeling the economy initially at the equilibrium at point A. b. Now show the combined effect of the two policies. Label the new equilibrium point B. Explain what you have done - which curve shifts which way and why! c....
8. a) Explain what the Fed will do when implementing an expansionary monetary policy using open...
8. a) Explain what the Fed will do when implementing an expansionary monetary policy using open market operations. b) Be as specific as possible about the ways in which this policy will conditions in our economy.
Monetary Policy: Keynesian model a. Draw graphs for the IS-LM-FE model, the AD-AS model, and labor...
Monetary Policy: Keynesian model a. Draw graphs for the IS-LM-FE model, the AD-AS model, and labor market equilibrium for the Keynesian model with efficiency wages for an economy in a long-run equilibrium. Label equilibrium points.
Monetary Policy and Money Markets a. Graph the demand and supply of money at equilibrium. Identify...
Monetary Policy and Money Markets a. Graph the demand and supply of money at equilibrium. Identify the area of excess supply of money and excess demand for money. b.Graph the impact of contractionary monetary policy on Aggregate Demand through monetary policy transmission into the economy- use 3 graphs to illustrate the impact. Graph and list all contractionary monetary policy. c. Explain the transmission of expansionary monetary policy transmission and list all expansionary monetary policy tools d. Define the equation of...
6. The long-run effects of monetary policy Aa Aa The following graphs show an economy that is cur...
 6. The long-run effects of monetary policy The following graphs show an economy that is currently in long-run equilibrium. The first graph shows the aggregate demand (AD) and long-run aggregate supply (LRAS) curves. The second shows the long-run (LR) and short-run (SR) Phillips curves. The point on each graph shows the economy's current position. According to the graphs, potential output in this economy is _______ and the natural rate of unemployment is _______ .Suppose the central bank of the economy decreases the...
Stabilization policies are often used to bring about economic equilibrium: 1. Monetary policy is implemented by...
 Stabilization policies are often used to bring about economic equilibrium: 1. Monetary policy is implemented by the Bank of Canada (or Central Bank) - Manipulation of short-term interest rates - Management of the money supply 2. Fiscal policy is the responsibility of the Department of Finance and the Treasu Board - Government spending levels - Government deficit and borrowing policies Question: How would each of these policies tools be deployed to address a recessionary gap? An inflationary gap?
1. Using a graph, show the impact of the contractionary monetary policy using Keynesian analysis. 2....
1. Using a graph, show the impact of the contractionary monetary policy using Keynesian analysis. 2. To create 3% growth in the economy, monetarists think the money supply should: a) increase by more than 3% yearly b) incr. less than 3% yearly c)incr. at 3% yearly d)decrease 3% yearly e) be constant 3. Use two graphs to depict what would happen If the fed buys a lot more T bonds than it sells, show the effect it will have in...
 the economy is experiencing a recession and high unemployment a. Use an AD-AS model together with the Fed Funds market to represent ther short ran equilibrium in b. What types of monetary policy (i.e.. expansionary or restrictive) should the Fed implement? c. In implementing the policy you suggest. which actions (please give at least two actions) should the Fed take to achieve this policy? Explain how t he y policy would address this problem and the consequence of the monetar...
 l
6. Monetary policy and the problem of inflationary and recessionary gaps On the following graph, the economy is producing at point A (grey star symbol), which corresponds to the intersection of the AD, and SRAS curves. The Federal Reserve ("the Fed") is considering whether to intervene in an effort to bring the economy back to its potential. ? LRAS SRAS, 165 160 No Intervention SRAS2 155 150 If Fed Intervenes PRICE LEVEL 145 140 AD2 135 ADA 130 125...
l
6. Monetary policy and the problem of inflationary and recessionary gaps On the following graph, the economy is producing at point A (grey star symbol), which corresponds to the intersection of the AD, and SRAS curves. The Federal Reserve ("the Fed") is considering whether to intervene in an effort to bring the economy back to its potential. ? LRAS SRAS, 165 160 No Intervention SRAS2 155 150 If Fed Intervenes PRICE LEVEL 145 140 AD2 135 ADA 130 125...
 2001, the Fed pursued an expansionary monetary policy and reduced interest rates. At the same time, President George W. Bush pushed through legislation that lowered Income taxes. "he accompanying IS-LM diagram describes the situation prior to any such policy changes. Initially the economy is at equilibrium point A. .) Using the line drawing tool, draw a new LM curve to illustrate the effect of an expansionary monetary policy. Property abel your curve. 2.) Using the 3-point curve drawing tool, draw...
 2) In 2001, the Fed pursued a very expansionary monetary policy. At the sametime, President George W. Bush pushed through legislation that lowered income taxes. a. Use the IS-LM diagram to describe the situation prior to any such policy changes labeling the economy initially at the equilibrium at point A. b. Now show the combined effect of the two policies. Label the new equilibrium point B. Explain what you have done - which curve shifts which way and why! c....
 Stabilization policies are often used to bring about economic equilibrium: 1. Monetary policy is implemented by the Bank of Canada (or Central Bank) - Manipulation of short-term interest rates - Management of the money supply 2. Fiscal policy is the responsibility of the Department of Finance and the Treasu Board - Government spending levels - Government deficit and borrowing policies Question: How would each of these policies tools be deployed to address a recessionary gap? An inflationary gap?
Most questions answered within 3 hours.
-
Using MARS simulator, write MIPS programs according to
the following scenarios: Receive a positive integer number...
asked 42 minutes ago -
An object in front of a concave mirror has a real image that is
11.5 cm...
asked 56 minutes ago -
Consider the reaction, C3 H8 + O2 --> CO2 + H2O. How many
moles of O2...
asked 2 hours ago -
You and your opponent both roll a fair die. If you both roll the
same number,...
asked 2 hours ago -
In a study of the accuracy of fast food drive-through orders,
Restaurant A had 257 accurate...
asked 2 hours ago -
Identify and describe in detail the four categories of
institutions that could be included in a...
asked 3 hours ago -
In python
class Customer:
def __init__(self, customer_id, last_name, first_name, phone_number, address):
self._customer_id = int(customer_id)
self._last_name =...
asked 3 hours ago -
What is an example of a limitation in implementing a new
ERP system and how it...
asked 3 hours ago -
In a section of 9.7cm of an artery with a radius of 2.6mm there
is a...
asked 3 hours ago -
the two carboxylic acid groups of aspartic acid have different
acidities with pKa values of 2.1...
asked 3 hours ago -
Would CuCO3 aqueous salt combined with calcium chloride
form a solid precipitate? If so, what would...
asked 3 hours ago -
How do ECM Solutions assist in embedding a culture of continuous
improvement in an organization? (Project...
asked 3 hours ago