


Homework Answers

Add Answer to:
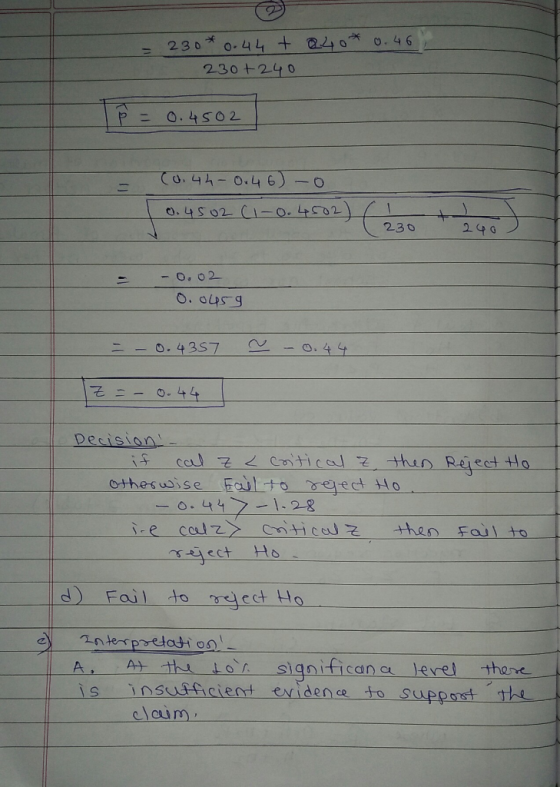
In a survey of 230 males ages 20 to 24,44% were neither in school nor working....
8.4.9-T E Question Help In a survey of 250 males ages 18 to 24, 36% were...
 8.4.9-T E Question Help In a survey of 250 males ages 18 to 24, 36% were enrolled in college. In a survey of 210 females ages 18 to 24,38% were enrolled in college. These sample are random and independent. Al 0.09, can you support the claim that the proportion of males ages 18 to 24 who enrolled in college is less than the proportion of females ages 18 to 24 who enrolled in college? (a) Identify the claim and state...
In a survey of 180 females who recently completed high school, 75% were enrolled in college....
 In a survey of 180 females who recently completed high school, 75% were enrolled in college. In a survey of 160 males who recently completed high school, 65% were enrolled in college. At a = 0.06, can you reject the claim that there is no difference in the proportion of college enrollees between the two groups? Assume the random samples are independent. Complete parts (a) through (@). (a) Identify the claim and state Ho and H. The claim is "the...
In a survey of 180 females who recently completed high school, 75% were enrolled in college....
 In a survey of 180 females who recently completed high school, 75% were enrolled in college. In a survey of 160 males who recently completed high school, 65% were enrolled in college. Atc=0.06, can you reject the claim that there is no difference in the proportion of college enrollees between the two groups? Assume the random samples are independent. Complete parts (a) through (e) (a) Identify the claim and state Ho and H. The claim is the proportion of female...
In a survey of 180 females who recently completed high school, 75% were enrolled in college....
 In a survey of 180 females who recently completed high school, 75% were enrolled in college. In a survey of 160 males who recently completed high school, 65% were enrolled in college. At a =0.06, can you reject the claim that there is no difference in the proportion of college enrollees between the two groups? Assume the random samples are independent. Complete parts (a) through (@). (a) Identify the claim and state Ho and Ha. The claim is "the proportion...
Course In a survey of 172 females who recently completed high school, 75% were enrolled in...
 Course In a survey of 172 females who recently completed high school, 75% were enrolled in college. In a survey of 160 males who recently completed high school, 65% were enrolled in college. At = 0.09, can you reject the claim that there is no difference in the proportion of college enrollees between the two groups? Assume the random samples are independent. Complete parts (a) through (e). Syllabus Class Ha (a) Identity the claim and state Ho and H. adet...
A recent survey showed that in a sample of 100 elementary school teachers, 15 were single....
 A recent survey showed that in a sample of 100 elementary school teachers, 15 were single. In a sample of 180 high school teachers, 36 were single. Is the proportion of high school teachers who were single greater than the proportion of elementary teachers who were single? Use a = 0.01. What are the hypotheses? A) Ho: P1 = P2 vs. H: P17 P2 B) Ho: P1 = P2 vs. Hy: P1 P2 C) Ho: P1 = P2 vs. Hy:...
In a survey of 1000 drivers from Region A, 849 wear a seat belt. In a...
 In a survey of 1000 drivers from Region A, 849 wear a seat belt. In a survey of 1000 drivers from Region B, 906 wear a seat belt. At a = 0.01, is there evidence to support the claim that the proportion of drivers who wear seat belts in Region A is less than the proportion of drivers who wear seat belts in Region B? Assume that the samples are random and independent. Complete parts (a) through (e) below. (a)...
In a survey conducted in August, 2017, a random sample of 2,752 U.S. adults were asked...
In a survey conducted in August, 2017, a random sample of 2,752 U.S. adults were asked whether they had visited a public library in the previous 12 months. The results of this survey are shown in the two-way table below, stratified by gender. Conduct a hypothesis test on this data, using a 10% significance level, to test the claim that the true proportion of U.S. adult males who visited a public library in the previous 12 months differs from the...
A state-by-state survey found that the pro tions of adults who are smokers i state A...
 A state-by-state survey found that the pro tions of adults who are smokers i state A and state were 21.0% and 25 2% especie y Suppose the number ofrespondents om each gate was 3000 At α=0.05, can you su port the e aim that the proportion of adults wh are smokers greater in state A than in staa B? Assumǚ the random sample; ara indapan dant. Com late parts (a) through (e). (a) Identify the daim and state HandH The...
A survey was conducted of newlyweds in a country who have a spouse of a different...
 A survey was conducted of newlyweds in a country who have a spouse of a different race or ethnicity from their own. The survey included random samples of 1000 newlyweds in Ethnicity A and 1000 newlyweds in Ethnicity B. In the survey, 10% of respondents in Ethnicity A and 21% of respondents in Ethnicity B had a spouse of a different race or ethnicity from their own. At a=0.01, is there evidence to support the claim that the proportion of...
 8.4.9-T E Question Help In a survey of 250 males ages 18 to 24, 36% were enrolled in college. In a survey of 210 females ages 18 to 24,38% were enrolled in college. These sample are random and independent. Al 0.09, can you support the claim that the proportion of males ages 18 to 24 who enrolled in college is less than the proportion of females ages 18 to 24 who enrolled in college? (a) Identify the claim and state...
 In a survey of 180 females who recently completed high school, 75% were enrolled in college. In a survey of 160 males who recently completed high school, 65% were enrolled in college. At a = 0.06, can you reject the claim that there is no difference in the proportion of college enrollees between the two groups? Assume the random samples are independent. Complete parts (a) through (@). (a) Identify the claim and state Ho and H. The claim is "the...
 In a survey of 180 females who recently completed high school, 75% were enrolled in college. In a survey of 160 males who recently completed high school, 65% were enrolled in college. Atc=0.06, can you reject the claim that there is no difference in the proportion of college enrollees between the two groups? Assume the random samples are independent. Complete parts (a) through (e) (a) Identify the claim and state Ho and H. The claim is the proportion of female...
 In a survey of 180 females who recently completed high school, 75% were enrolled in college. In a survey of 160 males who recently completed high school, 65% were enrolled in college. At a =0.06, can you reject the claim that there is no difference in the proportion of college enrollees between the two groups? Assume the random samples are independent. Complete parts (a) through (@). (a) Identify the claim and state Ho and Ha. The claim is "the proportion...
 Course In a survey of 172 females who recently completed high school, 75% were enrolled in college. In a survey of 160 males who recently completed high school, 65% were enrolled in college. At = 0.09, can you reject the claim that there is no difference in the proportion of college enrollees between the two groups? Assume the random samples are independent. Complete parts (a) through (e). Syllabus Class Ha (a) Identity the claim and state Ho and H. adet...
 A recent survey showed that in a sample of 100 elementary school teachers, 15 were single. In a sample of 180 high school teachers, 36 were single. Is the proportion of high school teachers who were single greater than the proportion of elementary teachers who were single? Use a = 0.01. What are the hypotheses? A) Ho: P1 = P2 vs. H: P17 P2 B) Ho: P1 = P2 vs. Hy: P1 P2 C) Ho: P1 = P2 vs. Hy:...
 In a survey of 1000 drivers from Region A, 849 wear a seat belt. In a survey of 1000 drivers from Region B, 906 wear a seat belt. At a = 0.01, is there evidence to support the claim that the proportion of drivers who wear seat belts in Region A is less than the proportion of drivers who wear seat belts in Region B? Assume that the samples are random and independent. Complete parts (a) through (e) below. (a)...
 A state-by-state survey found that the pro tions of adults who are smokers i state A and state were 21.0% and 25 2% especie y Suppose the number ofrespondents om each gate was 3000 At α=0.05, can you su port the e aim that the proportion of adults wh are smokers greater in state A than in staa B? Assumǚ the random sample; ara indapan dant. Com late parts (a) through (e). (a) Identify the daim and state HandH The...
 A survey was conducted of newlyweds in a country who have a spouse of a different race or ethnicity from their own. The survey included random samples of 1000 newlyweds in Ethnicity A and 1000 newlyweds in Ethnicity B. In the survey, 10% of respondents in Ethnicity A and 21% of respondents in Ethnicity B had a spouse of a different race or ethnicity from their own. At a=0.01, is there evidence to support the claim that the proportion of...
Most questions answered within 3 hours.
-
1. Which of the following is NOT an argument that McMahan uses
to show that jus...
asked 19 minutes ago -
A crate slides up a frictionless slope. At the end of 3 seconds
its velocity is...
asked 36 minutes ago -
Use the following information to answer the next seven
questions.
Suppose there are three potential states...
asked 32 minutes ago -
If we only have interstitial and substitutional diffusion, then
what do we consider the process of...
asked 48 minutes ago -
You look at yourself in a shiny 9.6-cm-diameter Christmas tree
ball.
If your face is 21.0...
asked 50 minutes ago -
If we were to measure the relaxation time of a muscle after
undergoing tetanus compared to...
asked 49 minutes ago -
4CO(g) + 8H2(g) -----> 3CH4(g) +
CO2(g) + 2H2O(l)
Use the following data as needed to...
asked 52 minutes ago -
without using map
1. Write a C++ program to find out the top 10 words in...
asked 1 hour ago -
1)Calculate the percent ionization of a
0.330 M solution of hypochlorous
acid.
% Ionization = %...
asked 1 hour ago -
1a) How many grams of K2SO4 are in 250mL
of 0.11 M K2SO4 solution?
_____ g...
asked 59 minutes ago -
The vapor pressure of a solution containing 38.7 g glycerin
(C3H8O3) in 146.2 g ethanol (C2H5OH)...
asked 1 hour ago -
A physics major is cooking breakfast when he notices that the
frictional force between the steel...
asked 1 hour ago