(S7.2) According to the Mars company, 20% of Peanut Butter M&Ms are orange. Calculate and interpret...
- (S7.2) According to the Mars company, 20% of Peanut Butter M&Ms are orange. Calculate and interpret what you’d expect if you took a sample of 100 Peanut Butter M&Ms:
????= ????=
We expect % of Peanut Butter M&Ms to be orange, give or take %.
- (S7.3) ) At a particular movie theater, one out of four patrons request extra butter on their popcorn.
- Suppose you randomly sample 117 patrons buying popcorn at the movie theater. What are the approximated parameters of the sampling distribution of ??̂ for samples of n = 117 where “success” is defined as requesting extra butter?
???? = ?????? ???? =
- What conditions need to be satisfied for CLT to apply?
- What is the probability that 30% or more of the patrons from your sample of 117 request extra butter?
Homework Answers
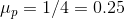
Q7.2) The mean and standard deviation of the sampling distribution of proportion here is computed as:


The interpretation of this is that we expect 20% of Peanut butter M&Ms to be orange, give or take 4% here.
Q7.3) a) Using the same methodology, the distribution here is obtained as:

b) We have here:
np = 0.25*117 = 29.25 > 5
n(1-p) = 117*(1 - 0.25) = 87.75 > 5
Therefore the conditions are satisfied here.
c) The probability that 30% or more of the patrons from your sample of 117 request extra butter is computed here as:
P( p >= 0.3)
Converting it to a standard normal variable, we have here:
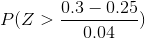

Getting it from the standard normal tables, we have here:

Therefore 0.1056 is the required probability here.
Add Answer to:
(S7.2) According to the Mars company, 20% of
Peanut Butter M&Ms are orange. Calculate and interpret...
The masterfoods company manufactures bags of peanut butter M&Ms. they report that they make 10% each...
The masterfoods company manufactures bags of peanut butter M&Ms. they report that they make 10% each brown and red candies, and 20% each yellow, blue, and orange candies. The rest of the candies are green. If you pick four M&Ms in a row, what is the probability that they are: A all blue? B none are green? C at least one is red? D the fourth one is the first one that is brown?
In a package of any type of M&M, the M&M Mars company claims there is a...
In a package of any type of M&M, the M&M Mars company claims there is a certain percentage of each color. For example, in a package of peanut M&M's in the USA; 12% are brown, 12% are red, 15% are yellow, 23% are blue, 15% are green and 23% are orange. In a recently purchased pack of peanut M&M's, 9 of the 65 peanut M&M's were brown. If we were to use this sample to create a 95% confidence interval,...
QUESTION 10 Mars, the company that makes M&Ms, has given proportions of their colors. Do mine...
 QUESTION 10 Mars, the company that makes M&Ms, has given proportions of their colors. Do mine match? A sample of 1515 M&Ms was taken with the data about the colors given in the following table of data? What is the expected count for blue M&Ms? Colors Red Yellow Blue Green Orange Brown Counts 182 165 368 274 362 164 Percents 13% 14% 24% 16% 19% 14% a. 363.6 b. 24% c. 368 d. 1515
According to Masterfoods, the company that manufactures M&M’s, 12% of peanut M&M’s are brown, 15% are...
According to Masterfoods, the company that manufactures M&M’s, 12% of peanut M&M’s are brown, 15% are yellow, 12% are red, 23% are blue, 23% are orange and 15% are green. You randomly select six peanut M&M’s from an extra-large bag of the candies. (Round all probabilities below to four decimal places; i.e. your answer should look like 0.1234, not 0.1234444 or 12.34%.) Compute the probability that exactly five of the six M&M’s are red Compute the probability that four or...
According to Masterfoods, the company that manufactures M&M's, 12% of peanut M&M's are brown, 15% are...
 According to Masterfoods, the company that manufactures M&M's, 12% of peanut M&M's are brown, 15% are yellow, 12% are red, 23% are blue, 23% are orange and 15% are green. You randomly select four peanut M&M's from an extra-large bag of the candies. (Round all probabilities below to four decimal places; i.e. your answer should look like 0.1234, not 0.1234444 or 12.34%.) Compute the probability that exactly three of the four M&M's are yellow. P(x = 3) Compute the probability...
According to Masterfoods, the company that manufactures M&M’s, 12% of peanut M&M’s are brown, 15% are...
 According to Masterfoods, the company that manufactures
M&M’s, 12% of peanut M&M’s are brown, 15% are yellow, 12%
are red, 23% are blue, 23% are orange and 15% are green. You
randomly select five peanut M&M’s from an extra-large bag of
the candies. (Round all probabilities below to four decimal places;
i.e. your answer should look like 0.1234, not 0.1234444 or
12.34%.)
Compute the probability that exactly two of the five M&M’s
are yellow.
Compute the probability that two or...
According to Masterfoods, the company that manufactures
M&M’s, 12% of peanut M&M’s are brown, 15% are yellow, 12%
are red, 23% are blue, 23% are orange and 15% are green. You
randomly select five peanut M&M’s from an extra-large bag of
the candies. (Round all probabilities below to four decimal places;
i.e. your answer should look like 0.1234, not 0.1234444 or
12.34%.)
Compute the probability that exactly two of the five M&M’s
are yellow.
Compute the probability that two or...
 QUESTION 10 Mars, the company that makes M&Ms, has given proportions of their colors. Do mine match? A sample of 1515 M&Ms was taken with the data about the colors given in the following table of data? What is the expected count for blue M&Ms? Colors Red Yellow Blue Green Orange Brown Counts 182 165 368 274 362 164 Percents 13% 14% 24% 16% 19% 14% a. 363.6 b. 24% c. 368 d. 1515
 According to Masterfoods, the company that manufactures M&M's, 12% of peanut M&M's are brown, 15% are yellow, 12% are red, 23% are blue, 23% are orange and 15% are green. You randomly select four peanut M&M's from an extra-large bag of the candies. (Round all probabilities below to four decimal places; i.e. your answer should look like 0.1234, not 0.1234444 or 12.34%.) Compute the probability that exactly three of the four M&M's are yellow. P(x = 3) Compute the probability...
 According to Masterfoods, the company that manufactures
M&M’s, 12% of peanut M&M’s are brown, 15% are yellow, 12%
are red, 23% are blue, 23% are orange and 15% are green. You
randomly select five peanut M&M’s from an extra-large bag of
the candies. (Round all probabilities below to four decimal places;
i.e. your answer should look like 0.1234, not 0.1234444 or
12.34%.)
Compute the probability that exactly two of the five M&M’s
are yellow.
Compute the probability that two or...
According to Masterfoods, the company that manufactures
M&M’s, 12% of peanut M&M’s are brown, 15% are yellow, 12%
are red, 23% are blue, 23% are orange and 15% are green. You
randomly select five peanut M&M’s from an extra-large bag of
the candies. (Round all probabilities below to four decimal places;
i.e. your answer should look like 0.1234, not 0.1234444 or
12.34%.)
Compute the probability that exactly two of the five M&M’s
are yellow.
Compute the probability that two or...
Most questions answered within 3 hours.
-
Water flowing uniformly in a rectangular open channel has
manning value of 0.017, bottom slope of...
asked 5 minutes ago -
Nature Conservancy's leader abruptly steps
down.
One morning in October 2007, Steven. J. McCormick the president...
asked 11 minutes ago -
I asked a question similar to this one, which was answered
perfectly. Another practice problem is...
asked 19 minutes ago -
Rachel is studying cholesterol synthesis in mice. Some mice
had a mutation in their sterol regulatory...
asked 16 minutes ago -
Railco sells to its customers on account with terms of 2% / 5
/net 15. Ronco...
asked 24 minutes ago -
Refer to the following lease amortization schedule. The 10
payments are made annually starting with the...
asked 38 minutes ago -
Explain how God fits into Aquinas' theory of happiness.
asked 46 minutes ago -
1.1 With aid of diagrams and suitable examples discuss
the economic effects of price controls.
1.2...
asked 51 minutes ago -
When the nuclide polonium-214 undergoes alpha
decay:
The name of the product nuclide is .
The...
asked 1 hour ago -
Q. The market demand function is D(Pd) = 160 - 2Pd and the
market supply function...
asked 1 hour ago -
An unknown alcohol is analyzed by freezing point depression. The
unknown is either methanol (CH3OH), ethanol...
asked 1 hour ago -
As a person inhales, air moves down the windpipe (bronchus),
through a constriction where the air...
asked 1 hour ago