Below are the marks (in percent) of a random sample of 10 students in a certain...
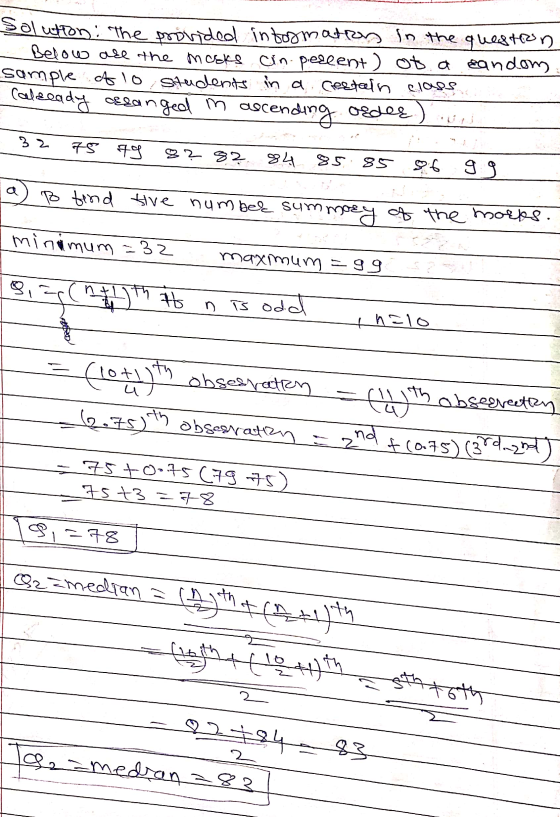
Below are the marks (in percent) of a random sample of 10 students in a certain class (already arranged in ascending order).
|
32 |
75 |
79 |
82 |
82 |
84 |
85 |
85 |
86 |
99 |
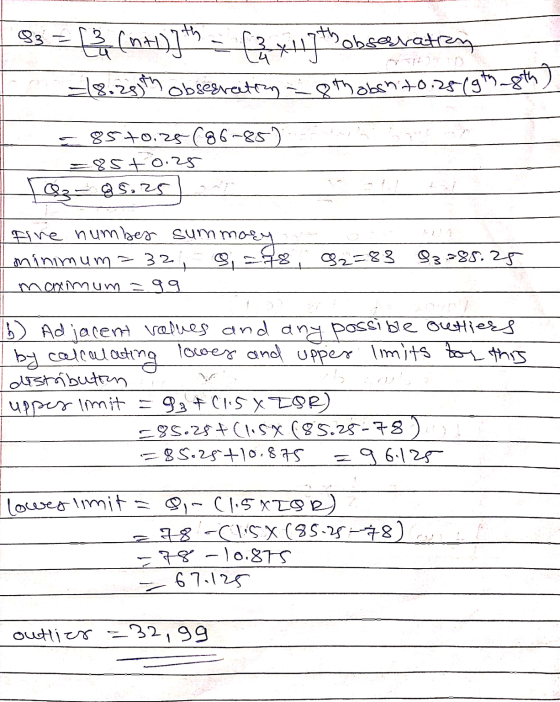
(a) Determine the five-number summary of the marks. (3 marks)
(b) Determine the adjacent values and any possible outliers by calculating lower and upper limits for this distribution. (3 marks)
Homework Answers
Add Answer to:
Below are the marks (in percent) of a
random sample of 10 students in a certain...
5. Mark’s class just took the admission test for business school and averaged 87.05. Chapter 10...
5. Mark’s class just took the admission test for business school and averaged 87.05. Chapter 10 Data Set 2 contains the population of scores for the 10 other classes in Mark’s university. How did Mark’s class do? Class 1 Class 2 Class 3 Class 4 Class 5 Class 6 Class 7 Class 8 Class 9 Class 10 78 81 96 85 88 78 90 79 96 86 77 78 97 90 88 82 86 93 87 89 78 93 88...
C++: Create a grade book program that includes a class of up to 20 students each...
C++: Create a grade book program that includes a class of up to 20 students each with 5 test grades (4 tests plus a Final). The sample gradebook input file (CSCI1306.txt) is attached. The students’ grades should be kept in an array. Once all students and their test scores are read in, calculate each student’s average (4 tests plus Final counts double) and letter grade for the class. The output of this program is a tabular grade report that is...
Consider the below matrixA, which you can copy and paste directly into Matlab.
Problem #1: Consider the below matrix A, which you can copy and paste directly into Matlab. The matrix contains 3 columns. The first column consists of Test #1 marks, the second column is Test # 2 marks, and the third column is final exam marks for a large linear algebra course. Each row represents a particular student.A = [36 45 75 81 59 73 77 73 73 65 72 78 65 55 83 73 57 78 84 31 60 83...
Problem 12. The following data are the arm lengths, in inches, of twenty students. For convenience,...
 Problem 12. The following data are the arm lengths, in inches, of twenty students. For convenience, the data are arranged in ascending order 25.1 26.1 26.3 26.4 26.8 27.0 272 273 27.5 27.6 27.8 28.6 28.7 28.7 28.9 29.2 30.5 31.5 31.7 32.0 (a) (2 points) Are the data qualitative or quantitative? If quantitative, are they discrete or continuous? (b) (2 points) Find the mean and standard deviation. (c) (2 points) Find the five number summary and shape of the...
Identify the lower class limits, upper class limits, class width, class midpoints, and class boundaries for...
 Identify the lower class limits, upper class limits, class width, class midpoints, and class boundaries for the given frequency distribution. Also identify the number of individuals included in the summary Age (yr) when award was won 25-34 35-44 45-54 55-64 65-74 75-84 85-94 Frequency 30 36 12 D 6 29.5.39.50 49.50, 59.50. 69.50, 79.50.89.50 Type integers or decimals. Do not round. Use ascending order) Identify the class boundarnies (Type integers or decimals. Do not round Use ascending order) Enter your...
Two placement exams are available that students can take to determine which math class they should...
 Two placement exams are
available that students can take to determine which math class they
should begin with in their freshman year. It is believed that there
is no difference in the mean scores that would be received for the
two tests. To test this using a 0.05 level of significance, a
randomly selected group of students took both tests and had their
scores recorded. The following data were obtained: Student Test A
Test B 1 78 82 2 86...
Two placement exams are
available that students can take to determine which math class they
should begin with in their freshman year. It is believed that there
is no difference in the mean scores that would be received for the
two tests. To test this using a 0.05 level of significance, a
randomly selected group of students took both tests and had their
scores recorded. The following data were obtained: Student Test A
Test B 1 78 82 2 86...
Course Home Support Portal ation Assessment Content Assignments The marks for Dr. Smiths?s third-...
 Course Home Support Portal ation Assessment Content Assignments The marks for Dr. Smiths?s third-year classes in zoology are given below Class A 71 82 55 76 66 71 90 84 95 64 71 70 73 45 73 51 68 Class B 54 80 12 61 73 69 92 81 80 61 75 74 15 44 91 63 50 84 1. Determine the three measures of central tendency 2 Calculate the variance and standard deviation 3 Determine the five figure summary...
Seven students got the following percentage of marks in Chemistry and Physics: Student 1 2 3...
 Seven students got the following percentage of marks in Chemistry and Physics: Student 1 2 3 4 5 6 7 Marks in 78 36 98 25 75 82 90 Chemistry Marks in 84 51 91 60 68 62 86 Physics Calculate the correlation co-efficient for above data.
8. The following data are scores from a Physics final administered to 34 students. 81 76...
 8. The following data are scores from a Physics final administered to 34 students. 81 76 93 99 47 67 69 72 83 88 56 62 91 94 98 63 77 84 98 75 79 67 73 65 89 86 91 85 97 73 56 92 88 83 Use the Chart below to construct a Frequency Distribution with 5 classes (15 pts) Class Tally (This column is optional.) Frequency
#1. Identify what type of sampling method is used (random, systematic, convenience, stratified, cluster). (a) To...
 #1. Identify what type of sampling method is used (random, systematic, convenience, stratified, cluster). (a) To judge the appeal of a proposed television sitcom, a random sample of 10 people from each of three different age categories was selected and those chosen were asked to rate a pilot show. (b) To maintain quality control in a brewery, every 1000th bottle of beer coming off the production line is opened and tested. #2. The scores of 40 students on a statistic...
 Problem 12. The following data are the arm lengths, in inches, of twenty students. For convenience, the data are arranged in ascending order 25.1 26.1 26.3 26.4 26.8 27.0 272 273 27.5 27.6 27.8 28.6 28.7 28.7 28.9 29.2 30.5 31.5 31.7 32.0 (a) (2 points) Are the data qualitative or quantitative? If quantitative, are they discrete or continuous? (b) (2 points) Find the mean and standard deviation. (c) (2 points) Find the five number summary and shape of the...
 Identify the lower class limits, upper class limits, class width, class midpoints, and class boundaries for the given frequency distribution. Also identify the number of individuals included in the summary Age (yr) when award was won 25-34 35-44 45-54 55-64 65-74 75-84 85-94 Frequency 30 36 12 D 6 29.5.39.50 49.50, 59.50. 69.50, 79.50.89.50 Type integers or decimals. Do not round. Use ascending order) Identify the class boundarnies (Type integers or decimals. Do not round Use ascending order) Enter your...
 Two placement exams are
available that students can take to determine which math class they
should begin with in their freshman year. It is believed that there
is no difference in the mean scores that would be received for the
two tests. To test this using a 0.05 level of significance, a
randomly selected group of students took both tests and had their
scores recorded. The following data were obtained: Student Test A
Test B 1 78 82 2 86...
Two placement exams are
available that students can take to determine which math class they
should begin with in their freshman year. It is believed that there
is no difference in the mean scores that would be received for the
two tests. To test this using a 0.05 level of significance, a
randomly selected group of students took both tests and had their
scores recorded. The following data were obtained: Student Test A
Test B 1 78 82 2 86...
 Course Home Support Portal ation Assessment Content Assignments The marks for Dr. Smiths?s third-year classes in zoology are given below Class A 71 82 55 76 66 71 90 84 95 64 71 70 73 45 73 51 68 Class B 54 80 12 61 73 69 92 81 80 61 75 74 15 44 91 63 50 84 1. Determine the three measures of central tendency 2 Calculate the variance and standard deviation 3 Determine the five figure summary...
 Seven students got the following percentage of marks in Chemistry and Physics: Student 1 2 3 4 5 6 7 Marks in 78 36 98 25 75 82 90 Chemistry Marks in 84 51 91 60 68 62 86 Physics Calculate the correlation co-efficient for above data.
 8. The following data are scores from a Physics final administered to 34 students. 81 76 93 99 47 67 69 72 83 88 56 62 91 94 98 63 77 84 98 75 79 67 73 65 89 86 91 85 97 73 56 92 88 83 Use the Chart below to construct a Frequency Distribution with 5 classes (15 pts) Class Tally (This column is optional.) Frequency
 #1. Identify what type of sampling method is used (random, systematic, convenience, stratified, cluster). (a) To judge the appeal of a proposed television sitcom, a random sample of 10 people from each of three different age categories was selected and those chosen were asked to rate a pilot show. (b) To maintain quality control in a brewery, every 1000th bottle of beer coming off the production line is opened and tested. #2. The scores of 40 students on a statistic...
Most questions answered within 3 hours.
-
Computer Programming II CS141(Java)
Mention the appropriate relationship between following
classes:
HOD–StaffMember
Car–Ferrari
Student-Address
BankAccount–FixedAccount
House-Building...
asked 2 hours ago -
Assume one of your finals has 50 questions on it, and
lucky for you, it's all...
asked 3 hours ago -
Rice Products in Bangladesh
Business behavior is derived in large part from the basic cultural
environment...
asked 4 hours ago -
The following base sequence is found for a mRNA fragment from
wild-type E. coli: 5'- UAUCAGUAGAUAAUGUAACC-3'...
asked 5 hours ago -
For this exercise, round all regression parameters to three
decimal places.
One of the two tables...
asked 5 hours ago -
What is the 5% level of significance for mean = 3.60, standard
deviation = 0.94, and...
asked 5 hours ago -
Prior to beginning work on this discussion, please read the
article by Hayley Peterson, 15 Companies...
asked 5 hours ago -
Which pair of aqueous solutions, when mixed, will form a
precipitate?
A) NaNO3 and AgC2H3O2
B)...
asked 6 hours ago -
1-Write an algorithm to get two numbers from the user (as
inputs) and calculate the sum...
asked 9 hours ago -
Define white-collar crime. What is the difference between
offender and offense-based definitions of white-collar crime? What...
asked 10 hours ago -
Consider a reaction which is 1st order with respect to A and 1st
order with respect...
asked 10 hours ago -
c++
The length of the hypotenuse of a right-angled triangle is the
square root of the...
asked 10 hours ago