
Homework Answers
Solve using Excel:
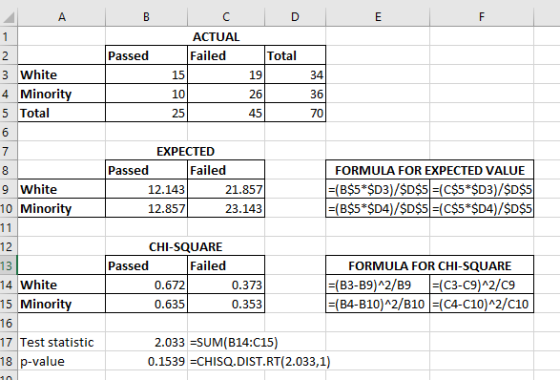
| ACTUAL | |||||
| Passed | Failed | Total | |||
| White | 15 | 19 | 34 | ||
| Minority | 10 | 26 | 36 | ||
| Total | 25 | 45 | 70 | ||
| EXPECTED | |||||
| Passed | Failed | FORMULA FOR EXPECTED VALUE | |||
| White | 12.143 | 21.857 | =(B$5*$D3)/$D$5 | =(C$5*$D3)/$D$5 | |
| Minority | 12.857 | 23.143 | =(B$5*$D4)/$D$5 | =(C$5*$D4)/$D$5 | |
| CHI-SQUARE | |||||
| Passed | Failed | FORMULA FOR CHI-SQUARE | |||
| White | 0.672 | 0.373 | =(B3-B9)^2/B9 | =(C3-C9)^2/C9 | |
| Minority | 0.635 | 0.353 | =(B4-B10)^2/B10 | =(C4-C10)^2/C10 | |
| Test statistic | 2.033 | =SUM(B14:C15) | |||
| p-value | 0.1539 | =CHISQ.DIST.RT(2.033,1) |
H0: White and minority candidates have the same chance of passing the test
H1: White and minority candidates have the same chance of passing the test (Option 1)
Test statistic = 2.033
Degrees of freedom: df = (rows-1)*(columns-1) = (2-1)*(2-1) = 1, Level of significance = 0.05
p-value (Using Excel function CHISQ.DIST.RT(test statistic, df)) = CHISQ.INV.RT(2.033,1) = 0.1539
Since p-value is more than 0.05, we do not reject the null hypothesis.
There is not sufficient evidence to support the claim that results are discriminatory (Option A)
Add Answer to:
Results from a civil corvant excam are shown in the table to the right is there...
Passed Failed Results from a civil servant exam are shown in the table to the right....
 Passed Failed Results from a civil servant exam are shown in the table to the right. Is there sufficient evidence to support the claim that the results from the teet are discriminatory? Use a 0.05 significance level 20 17 White candidates Minority candidates B 21 Determine the null and alternative hypotheses OA. H: A white candidate is not more likely to pass the test than a minority candidate. H.: A white candidate is more likely to pass the test man...
Passed 19 Falled 15 Results from a civil servant exam are shown in the table to...
 Passed 19 Falled 15 Results from a civil servant exam are shown in the table to the right. Is there sufficient evidence to support the claim that the results from the tost are White candidates Minority candidates 9 O A Hoi A white candidate is more likely to pass the tool than a minority candidato Hy: A white candidate is not more likely to pass the lost than a minority candidate B. Hy: White and minority candidates do not have...
please find p-value Passed Failed 20 16 Results from a civil servant exam are shown in...
 please find p-value
Passed Failed 20 16 Results from a civil servant exam are shown in the table to the right. Is there sufficient evidence to support the claim that the results from the test are discriminatory? Use a 0.01 significance level. White candidates Minority candidates 8 28 Determine the null and alternative hypotheses. O A. Ho: A white candidate is more likely to pass the test than a minority candidate. Hy: A white candidate is not more likely to...
please find p-value
Passed Failed 20 16 Results from a civil servant exam are shown in the table to the right. Is there sufficient evidence to support the claim that the results from the test are discriminatory? Use a 0.01 significance level. White candidates Minority candidates 8 28 Determine the null and alternative hypotheses. O A. Ho: A white candidate is more likely to pass the test than a minority candidate. Hy: A white candidate is not more likely to...
Passed Falled 1814 cancel at the results from the best are discriminatory Use a 0.01 White...
 Passed Falled 1814 cancel at the results from the best are discriminatory Use a 0.01 White candidates Minority candidates its from a civil servant exam are shown in the table to the night. Is there sufficient evidence to support the aim ermine the null and whernative hypotheses. A Ho: A white candidate is not more likely to pass the best than a minority candidate Hy: A white candidate is more likely to pass the best than a minority candidate B....
A. Determine the Test Statistic x2=______(Round to three decimal places as needed) Determine the P-Value of...
 A.
Determine the Test Statistic
x2=______(Round to three decimal places as
needed)
Determine the P-Value of the test
statistic
P-value=_____(Round to four
decimal places as needed)
Do the results suggest that polygraphs are effective in
distinguishing between truth and lies?
A.There is not sufficient evidence to warrant rejection of the
claim that whether a subject lies is independent of the polygraph
test indication.
B.There is sufficient evidence to warrant rejection of the claim
that whether a subject lies is independent...
A.
Determine the Test Statistic
x2=______(Round to three decimal places as
needed)
Determine the P-Value of the test
statistic
P-value=_____(Round to four
decimal places as needed)
Do the results suggest that polygraphs are effective in
distinguishing between truth and lies?
A.There is not sufficient evidence to warrant rejection of the
claim that whether a subject lies is independent of the polygraph
test indication.
B.There is sufficient evidence to warrant rejection of the claim
that whether a subject lies is independent...
Results from a civil servant exam are shown in the table to the right. Is there...
Results from a civil servant exam are shown in the table to the right. Is there sufficient evidence to support the claim that the results from the test are discriminatory? Use a 0.01 significance level. Passed Failed White candidates 17 13 Minority candidates 11 22
Consider a drug testing company that provides a test for marijuara usage. Among 301 tested subjects,...
 Consider a drug testing company that provides a test for marijuara usage. Among 301 tested subjects, results from 27 subjects were wrong (either a faise positive or a faise negative. Une 0.01 significance level to test the claim that less tha 10 percent of the best results are wrong. Identify the null and alterative hypotheses for this test. Choose the correct answer below. O A M:p=0.1 Hp01 OB. Hy:p 0.1 Hyp<0.1 OC. Hyp<0.1 Hp0.1 OD Mp=0.1 Hyp#01 Identity the best...
A study was done using a treatment group and a placebo group. The results are shown...
 A study was done using a treatment group and a placebo group. The results are shown in the table. Assume that the two samples are independent simple random samples selected from nom assume that the population standard deviations are equal. Complete all parts below. Use a 0.05 significance level Test the claim that the two samples are from populations with the same mean. What are the null and alternative hypotheses? O A. Ho: *12 H₂ H <H2 C. Hos H,...
A study was done on proctored and nonproctored tests. The results are shown in the table....
 A study was done on proctored and nonproctored tests. The results are shown in the table. Assume that the two samples are independent simple random samples selected from normally distributed populations, and do not assume that the population standard deviations are equal Complete parts (a) and (b) below. Use a 0.05 significance level for both parts. n Proctored Nonproctorec 12 31 30 75.98 86.26 10.57 19.42 X in a. Test the claim that students taking nonproctored tests get a higher...
The accompanying table gives results from a study of words spoken in a day by men...
 The accompanying table gives results from a study of words spoken in a day by men and women. Assume that both samples are independent simple random samples from populations having normal distributions. Use a 0.05 significance level to test the claim that the numbers of words spoken in a day by men vary more than the numbers of words spoken in a day by women. Men Women 186 210 15,668.6 16,215.3 8,632.9 7,301.2 What are the null and alternative hypotheses?...
 Passed Failed Results from a civil servant exam are shown in the table to the right. Is there sufficient evidence to support the claim that the results from the teet are discriminatory? Use a 0.05 significance level 20 17 White candidates Minority candidates B 21 Determine the null and alternative hypotheses OA. H: A white candidate is not more likely to pass the test than a minority candidate. H.: A white candidate is more likely to pass the test man...
 Passed 19 Falled 15 Results from a civil servant exam are shown in the table to the right. Is there sufficient evidence to support the claim that the results from the tost are White candidates Minority candidates 9 O A Hoi A white candidate is more likely to pass the tool than a minority candidato Hy: A white candidate is not more likely to pass the lost than a minority candidate B. Hy: White and minority candidates do not have...
 please find p-value
Passed Failed 20 16 Results from a civil servant exam are shown in the table to the right. Is there sufficient evidence to support the claim that the results from the test are discriminatory? Use a 0.01 significance level. White candidates Minority candidates 8 28 Determine the null and alternative hypotheses. O A. Ho: A white candidate is more likely to pass the test than a minority candidate. Hy: A white candidate is not more likely to...
please find p-value
Passed Failed 20 16 Results from a civil servant exam are shown in the table to the right. Is there sufficient evidence to support the claim that the results from the test are discriminatory? Use a 0.01 significance level. White candidates Minority candidates 8 28 Determine the null and alternative hypotheses. O A. Ho: A white candidate is more likely to pass the test than a minority candidate. Hy: A white candidate is not more likely to...
 Passed Falled 1814 cancel at the results from the best are discriminatory Use a 0.01 White candidates Minority candidates its from a civil servant exam are shown in the table to the night. Is there sufficient evidence to support the aim ermine the null and whernative hypotheses. A Ho: A white candidate is not more likely to pass the best than a minority candidate Hy: A white candidate is more likely to pass the best than a minority candidate B....
 A.
Determine the Test Statistic
x2=______(Round to three decimal places as
needed)
Determine the P-Value of the test
statistic
P-value=_____(Round to four
decimal places as needed)
Do the results suggest that polygraphs are effective in
distinguishing between truth and lies?
A.There is not sufficient evidence to warrant rejection of the
claim that whether a subject lies is independent of the polygraph
test indication.
B.There is sufficient evidence to warrant rejection of the claim
that whether a subject lies is independent...
A.
Determine the Test Statistic
x2=______(Round to three decimal places as
needed)
Determine the P-Value of the test
statistic
P-value=_____(Round to four
decimal places as needed)
Do the results suggest that polygraphs are effective in
distinguishing between truth and lies?
A.There is not sufficient evidence to warrant rejection of the
claim that whether a subject lies is independent of the polygraph
test indication.
B.There is sufficient evidence to warrant rejection of the claim
that whether a subject lies is independent...
 Consider a drug testing company that provides a test for marijuara usage. Among 301 tested subjects, results from 27 subjects were wrong (either a faise positive or a faise negative. Une 0.01 significance level to test the claim that less tha 10 percent of the best results are wrong. Identify the null and alterative hypotheses for this test. Choose the correct answer below. O A M:p=0.1 Hp01 OB. Hy:p 0.1 Hyp<0.1 OC. Hyp<0.1 Hp0.1 OD Mp=0.1 Hyp#01 Identity the best...
 A study was done using a treatment group and a placebo group. The results are shown in the table. Assume that the two samples are independent simple random samples selected from nom assume that the population standard deviations are equal. Complete all parts below. Use a 0.05 significance level Test the claim that the two samples are from populations with the same mean. What are the null and alternative hypotheses? O A. Ho: *12 H₂ H <H2 C. Hos H,...
 A study was done on proctored and nonproctored tests. The results are shown in the table. Assume that the two samples are independent simple random samples selected from normally distributed populations, and do not assume that the population standard deviations are equal Complete parts (a) and (b) below. Use a 0.05 significance level for both parts. n Proctored Nonproctorec 12 31 30 75.98 86.26 10.57 19.42 X in a. Test the claim that students taking nonproctored tests get a higher...
 The accompanying table gives results from a study of words spoken in a day by men and women. Assume that both samples are independent simple random samples from populations having normal distributions. Use a 0.05 significance level to test the claim that the numbers of words spoken in a day by men vary more than the numbers of words spoken in a day by women. Men Women 186 210 15,668.6 16,215.3 8,632.9 7,301.2 What are the null and alternative hypotheses?...
Most questions answered within 3 hours.
-
Calculate the pH of each of the following solutions.
0.50 M HBr
3.1×10⁻⁴ M KOH
4.2×10⁻⁵...
asked 2 hours ago -
For the year ended December 31, Depot Max’s cost of merchandise
sold was $85,600. Inventory at the...
asked 2 hours ago -
Week 10 - Professional Memo Assignment
Professional Memo Assignment
Your mission for this week, should you...
asked 2 hours ago -
Write a Python program that stores the data for each
player on the team, and it...
asked 2 hours ago -
In
the last 3 months, mike never knows when he is going to get his
allowance...
asked 3 hours ago -
Is Ca(OH)2 a Bronsted base, Lewis base, or both? Why?
asked 3 hours ago -
1A- Why don’t voters complain about U.S. tariffs on imported
sugar?
Because sugar is only a...
asked 3 hours ago -
Cash Payback Period
Primera Banco is evaluating two capital investment proposals for
a drive-up ATM kiosk,...
asked 3 hours ago -
Create a button in Swift (Xcode) that will create a charge,
create a charge using Stripe's...
asked 3 hours ago -
The reaction rate of CO and NO2 in the reaction
CO(g) + NO2(g) → CO2(g) +...
asked 3 hours ago -
Imagine that a chemist puts 6.40 mol each of
C3H8 and O2 in a 1.00-L container...
asked 3 hours ago -
How much money should be invested today in order to have $8340
at the end of...
asked 3 hours ago