


Homework Answers
![p-value = 2(P. (tan 144]] [sing t table] 700779) G10:1558 Since, P-value is greater than the x=0:05 So, Do not rejeck Ho Corm](http://img.homeworklib.com/questions/4d6b33b0-e236-11ea-9bc0-f5544a51ad6f.png?x-oss-process=image/resize,w_560)
Add Answer to:
A study was done using a treatment group and a placebo group. The results are shown...
Treatment Placebo A study was done using a treatment group and a placebo group. The results...
 Treatment Placebo A study was done using a treatment group and a placebo group. The results are shown in the table. Assume that the two samples are independent simple random samples selected from normally distributed populations, and do not assume that Hy the population standard deviations are equal. Complete parts (a) and (b) below. Use a 0.06 significance level for both parts. In 35 3a x 2.32 2.69 5 0 . 0.56 a. Test the claim that the two samples...
A study was done using a treatment group and a placebo group. The results are shown...
 A study was done using a treatment group and a placebo group. The results are shown in the table. Assume that the two samples are independent simple random samples selected from normally distributed populations, and do not assume that the population standard deviations are equal. Complete parts (a) and (b) below. Use a 0.10 significance level for both parts. n Treatment Placebo H2 34 40 2.39 2.62 0.56 0.85 X S UU. 110 H1 H2 H:H1 H2 UU. 110-11-12 HH1...
table. 4) A study was done using a treatment group and a placebo group. The results...
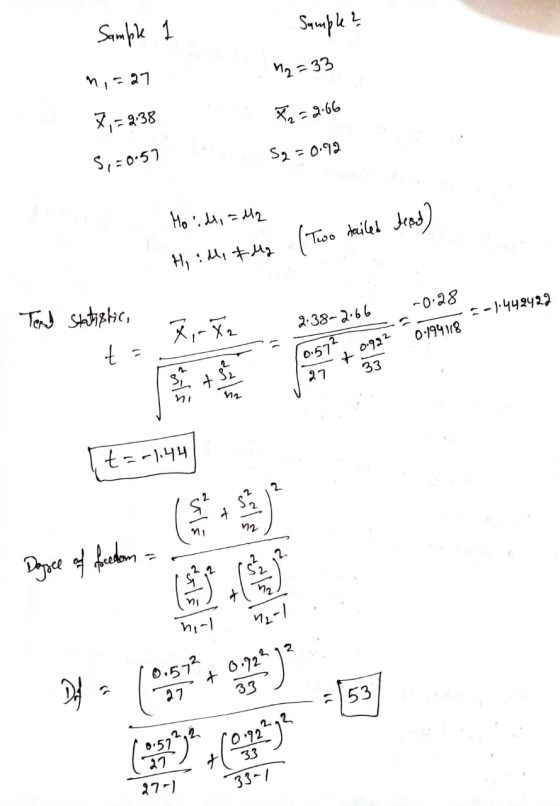
 table. 4) A study was done using a treatment group and a placebo group. The results are shown in the Assume that the two samples are independent simple random samples selected from normally disthibute populations, and do not assume that the population standard deviations are equal. Use a 0.05 significance level. Treatment Placebo n 27 x 2.38 s0.67 ?2 38 2.68 0.98 a) What are the null and alternative hypotheses? (4 pts b) The test statistic, t, is c) What...
9.2.01 Treatment Placebo group and from norruse 0.055 A study was done using a treatment group...
 9.2.01 Treatment Placebo group and from norruse 0.055 A study was done using a treatment group and a placebo group. The results are shown in the table. Assume that the two samples are independent simple random samples selected from normally distributed populations, and do not assume that the population standard deviations are equal. Complete parts (a) and (b) below. Use a 0.05 significance level for both parts. n x 25 2.31 0.66 2.61 0.92 O C. Ho: H1 H2 Hy:...
I just need Help with part B please A study was done using a treatment group...
 I just need Help with part B please
A study was done using a treatment group and a placebo group. The results are shown in the table. Assume that the two samples are independent simple random samples selected from normally distributed populations, and do not assume that the population standard deviations are equal. Complete parts (a) and n (b) below. Use a 0.01 significance level for both parts. X Treatment Placebo 11 HE 27 31 2.38 2.62 0.89 0.62 HH,...
I just need Help with part B please
A study was done using a treatment group and a placebo group. The results are shown in the table. Assume that the two samples are independent simple random samples selected from normally distributed populations, and do not assume that the population standard deviations are equal. Complete parts (a) and n (b) below. Use a 0.01 significance level for both parts. X Treatment Placebo 11 HE 27 31 2.38 2.62 0.89 0.62 HH,...
Treatment Piacebo A study was done using a treatment group and a placebo group. The resuits...
 Treatment Piacebo A study was done using a treatment group and a placebo group. The resuits are shown in the table Assume that the two samples are independent simgle random sampies selected from normaly datrbure populations, and do not assme that the population standard deviations are equa. Complete (a) and (b) belo" use a 0 01 s celevel for bon pats The test statisic, t, is -1.12 (Round to two decimal places as needed) The P-value is 267 (Round to...
1) A study was done using a treatment group and a placebo group. The results are shown in the tab...
 1) A study was done using a treatment group and a placebo group.
The results are shown in the table. Assume that the two samples are
independent simple random samples selected from normally
distributed populations, and do not assume that the population
standard deviations are equal. Use a 0.10 significance level for
both parts.
2) A study was done on body temperatures of men and women. The
results are shown in the table. Assume that the two samples are
independent...
1) A study was done using a treatment group and a placebo group.
The results are shown in the table. Assume that the two samples are
independent simple random samples selected from normally
distributed populations, and do not assume that the population
standard deviations are equal. Use a 0.10 significance level for
both parts.
2) A study was done on body temperatures of men and women. The
results are shown in the table. Assume that the two samples are
independent...
A study was done using a treatment group and a placebo group. The results are shown...
A study was done using a treatment group and a placebo group. The results are shown in the table. Assume that the two samples are independent simple random samples selected from normally distributed populations, and do not assume that the population standard deviations are equal. Complete parts (a) through (c) below. Use a 0.05 significance level for both parts. Treatment Placebo μ μ1 μ2 n 27 31 x overbarx 2.31 2.62 s 0.99 0.67 a. Test the claim that the...
A. B. 2. The test statistic,is ______ (Round to two decimal places as needed.) 3. The P-value is ______ (Round t...
 A.
B.
2. The test statistic,is ______
(Round to two decimal places as needed.)
3. The P-value is ______
(Round to three decimal places as needed.)
4. State the conclusion for the test.
________________ the null hypothesis. There ______ sufficient
evidence to support the claim that those treated with magnets have
a greater mean reduction in pain than those given a sham
treatment.
5. Is it valid to argue that magnets might appear to be
effective if the sample sizes...
A.
B.
2. The test statistic,is ______
(Round to two decimal places as needed.)
3. The P-value is ______
(Round to three decimal places as needed.)
4. State the conclusion for the test.
________________ the null hypothesis. There ______ sufficient
evidence to support the claim that those treated with magnets have
a greater mean reduction in pain than those given a sham
treatment.
5. Is it valid to argue that magnets might appear to be
effective if the sample sizes...
Given in the table are the BMI statistics for random samples of men and women. Assume...
 Given in the table are the BMI statistics for random samples of men and women. Assume that the two samples are independent simple random samples selected from normally distributed populations, and do not assume that the population standard deviations are equal. Complete parts (a) and (b) below. Use a 0.05 significance level for both parts. n Male BMI Female BMI 1 12 50 50 27.5997 25 6435 8.819325 4.764227 X S a. Test the claim that males and females have...
 Treatment Placebo A study was done using a treatment group and a placebo group. The results are shown in the table. Assume that the two samples are independent simple random samples selected from normally distributed populations, and do not assume that Hy the population standard deviations are equal. Complete parts (a) and (b) below. Use a 0.06 significance level for both parts. In 35 3a x 2.32 2.69 5 0 . 0.56 a. Test the claim that the two samples...
 A study was done using a treatment group and a placebo group. The results are shown in the table. Assume that the two samples are independent simple random samples selected from normally distributed populations, and do not assume that the population standard deviations are equal. Complete parts (a) and (b) below. Use a 0.10 significance level for both parts. n Treatment Placebo H2 34 40 2.39 2.62 0.56 0.85 X S UU. 110 H1 H2 H:H1 H2 UU. 110-11-12 HH1...
 table. 4) A study was done using a treatment group and a placebo group. The results are shown in the Assume that the two samples are independent simple random samples selected from normally disthibute populations, and do not assume that the population standard deviations are equal. Use a 0.05 significance level. Treatment Placebo n 27 x 2.38 s0.67 ?2 38 2.68 0.98 a) What are the null and alternative hypotheses? (4 pts b) The test statistic, t, is c) What...
 9.2.01 Treatment Placebo group and from norruse 0.055 A study was done using a treatment group and a placebo group. The results are shown in the table. Assume that the two samples are independent simple random samples selected from normally distributed populations, and do not assume that the population standard deviations are equal. Complete parts (a) and (b) below. Use a 0.05 significance level for both parts. n x 25 2.31 0.66 2.61 0.92 O C. Ho: H1 H2 Hy:...
 I just need Help with part B please
A study was done using a treatment group and a placebo group. The results are shown in the table. Assume that the two samples are independent simple random samples selected from normally distributed populations, and do not assume that the population standard deviations are equal. Complete parts (a) and n (b) below. Use a 0.01 significance level for both parts. X Treatment Placebo 11 HE 27 31 2.38 2.62 0.89 0.62 HH,...
I just need Help with part B please
A study was done using a treatment group and a placebo group. The results are shown in the table. Assume that the two samples are independent simple random samples selected from normally distributed populations, and do not assume that the population standard deviations are equal. Complete parts (a) and n (b) below. Use a 0.01 significance level for both parts. X Treatment Placebo 11 HE 27 31 2.38 2.62 0.89 0.62 HH,...
 Treatment Piacebo A study was done using a treatment group and a placebo group. The resuits are shown in the table Assume that the two samples are independent simgle random sampies selected from normaly datrbure populations, and do not assme that the population standard deviations are equa. Complete (a) and (b) belo" use a 0 01 s celevel for bon pats The test statisic, t, is -1.12 (Round to two decimal places as needed) The P-value is 267 (Round to...
 1) A study was done using a treatment group and a placebo group.
The results are shown in the table. Assume that the two samples are
independent simple random samples selected from normally
distributed populations, and do not assume that the population
standard deviations are equal. Use a 0.10 significance level for
both parts.
2) A study was done on body temperatures of men and women. The
results are shown in the table. Assume that the two samples are
independent...
1) A study was done using a treatment group and a placebo group.
The results are shown in the table. Assume that the two samples are
independent simple random samples selected from normally
distributed populations, and do not assume that the population
standard deviations are equal. Use a 0.10 significance level for
both parts.
2) A study was done on body temperatures of men and women. The
results are shown in the table. Assume that the two samples are
independent...
 A.
B.
2. The test statistic,is ______
(Round to two decimal places as needed.)
3. The P-value is ______
(Round to three decimal places as needed.)
4. State the conclusion for the test.
________________ the null hypothesis. There ______ sufficient
evidence to support the claim that those treated with magnets have
a greater mean reduction in pain than those given a sham
treatment.
5. Is it valid to argue that magnets might appear to be
effective if the sample sizes...
A.
B.
2. The test statistic,is ______
(Round to two decimal places as needed.)
3. The P-value is ______
(Round to three decimal places as needed.)
4. State the conclusion for the test.
________________ the null hypothesis. There ______ sufficient
evidence to support the claim that those treated with magnets have
a greater mean reduction in pain than those given a sham
treatment.
5. Is it valid to argue that magnets might appear to be
effective if the sample sizes...
 Given in the table are the BMI statistics for random samples of men and women. Assume that the two samples are independent simple random samples selected from normally distributed populations, and do not assume that the population standard deviations are equal. Complete parts (a) and (b) below. Use a 0.05 significance level for both parts. n Male BMI Female BMI 1 12 50 50 27.5997 25 6435 8.819325 4.764227 X S a. Test the claim that males and females have...
Most questions answered within 3 hours.
-
What are the energies expressed in keV of the Ka1 and La1
fluorescence photons for lead...
asked 7 minutes ago -
Calculate G° for each reaction at 298K using G°f values.
2 CH3OH(g) + 3 O2(g) 2...
asked 22 minutes ago -
Which factor is not relevant in deciding whether or not to
accept a special order?
Incremental...
asked 31 minutes ago -
Balance the reaction:
SnCl2 + K2Cr2O7 + HCl → CrCl3 + KCl + SnCl4 + H2O...
asked 33 minutes ago -
It takes 10.34
mL of 1.24 M H C l to neutralize 21.47 mL of N...
asked 39 minutes ago -
A halfback is initially running south at a speed of 8.70 m/s,
quickly cuts to his...
asked 44 minutes ago -
6. A researcher believes that young men experiment with alcohol
and other substances earlier than do...
asked 55 minutes ago -
Complete the balanced OVERALL IONIC EQUATION for the mixing of
these two solutions. (INCLUDE STATES OF...
asked 1 hour ago -
Here is the combustion reaction for octane (C8H18), which is a
primary component of gasoline. How...
asked 1 hour ago -
List and discuss the various forms of marriage arrangements.
What are the advantages and disadvantages of...
asked 55 minutes ago -
2. Two conductors having net charges of +16.0 µC and -16.0 µC
have a potential difference...
asked 57 minutes ago -
How fast would you have to throw a baseball ( m=145 g) to give
it the...
asked 57 minutes ago