2) Student Population Data From Western Carolina University Number Year Enrolled 1 2006 8,860 2...
2) Student Population Data From Western Carolina University
|
Number |
Year |
Enrolled |
|
1 |
2006 |
8,860 |
|
2 |
2007 |
9,056 |
|
3 |
2008 |
9,050 |
|
4 |
2009 |
9,429 |
|
5 |
2010 |
9,407 |
|
6 |
2011 |
9,352 |
|
7 |
2012 |
9,608 |
|
8 |
2013 |
10,107 |
|
9 |
2014 |
10,382 |
|
10 |
2015 |
10,340 |
|
11 |
2016 |
10,805 |
|
12 |
2017 |
11,034 |
|
13 |
2018 |
11,639 |
3) What is the correlation between year and student population?
4) What is the regression model for the data? Is this a good model?
5) What do you predict the student population will be in 2019?
Homework Answers

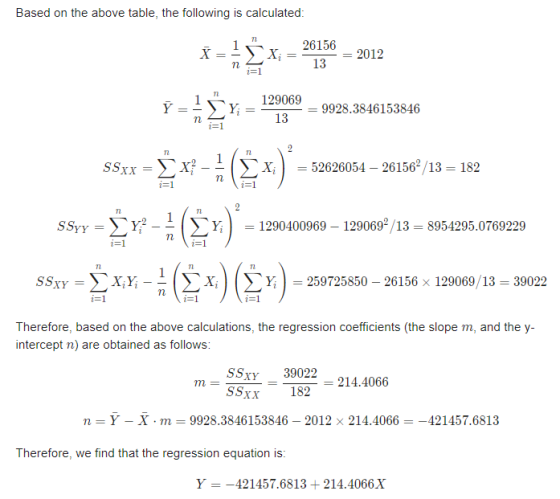
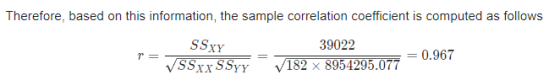
Since, the correlation coefficient is close to 1 , we can say that the model is good.
For X = 2019

Add Answer to:
2) Student Population Data From Western Carolina University
Number
Year
Enrolled
1
2006
8,860
2...
What is the correlation between year and student population? Year 2006 = 8,860 Students 2007 =...
What is the correlation between year and student population? Year 2006 = 8,860 Students 2007 = 9,056 2008 = 9,050 2009 = 9,429 2010 = 9,407 2011 = 9,352 2012 = 9,608 2013 = 10,107 2014 = 10,382 2015 = 10,340 2016 = 10,805 2017 = 11,034 2018 = 11,639
What do you predict the student population will be in 2019? Year 2006 = 8,860 Students...
What do you predict the student population will be in 2019? Year 2006 = 8,860 Students 2007 = 9,056 2008 = 9,050 2009 = 9,429 2010 = 9,407 2011 = 9,352 2012 = 9,608 2013 = 10,107 2014 = 10,382 2015 = 10,340 2016 = 10,805 2017 = 11,034 2018 = 11,639
7.9 3.3 2. Consider the following data from 2001 - 2017, column 1 is the year,...
 7.9 3.3 2. Consider the following data from 2001 - 2017, column 1 is the year, the 2nd column is the unemployment rate, and the 3rd column is the inflation rate. Plot the data using a scatter plot and argue whether in your opinion, the Phillips Curve has validity. 2001 5.7 1.6 2002 6.0 2.4 2003 5.7 2004 2005 2006 2007 2008 2009 2010 2011 2012 2013 2014 2015 2016 2017 4.1 3.0 0.7
Reserve Problems Chapter 11 Section 2 Problem 1 The department of health studied the number of...
 Reserve Problems Chapter 11 Section 2 Problem 1 The department of health studied the number of patients who need liver transplantation. The following data are the Liver Transplantation Waiting List (LTWL), where y is the size (in number of patients) and x is the corresponding year: 1351 17802741 384047616737744373667597821082068423 8889 * 2000 2001 2002 2003 2004 2005 2006 2007 2008 2009 2010 2011 2012 Round your intermediate answers to four decimal places (e.g. 98.7654). (a) Fit the simple linear regression...
Reserve Problems Chapter 11 Section 2 Problem 1 The department of health studied the number of...
 Reserve Problems Chapter 11 Section 2 Problem 1 The department of health studied the number of patients who need liver transplantation. The following data are the Liver Transplantation Waiting List (LTL), where is the site in number of patients) and is the corresponding year: 1303 1807 2819 3802 4783 6716 749974357658 8354 8430 84948938 * 2003 2004 2005 2006 2007 2008 2009 2010 2011 2012 2013 2014 2015 Round your intermediate answers to four decimal places (e.p.98.7654) (a) Fit the...
Consider the following set of data on the performance rating of an employee in an organization. The rating is ranging from 0 to 4. 0 - very poor 1 - poor 2 - average 3 - Excellent 4 - Outstanding . 1....
Consider the following set of data on the performance rating of an employee in an organization. The rating is ranging from 0 to 4. 0 - very poor 1 - poor 2 - average 3 - Excellent 4 - Outstanding . 1. Analyze the given data and rank them based on their performance. And give reasons. 2. Analyzing their performance between 2011 and 2017, what can you decide about their performance? 3. If the results of 1 and 2 are...
Reserve Problems Chapter 11 Section 2 Problem 1 The department of health studied the number of...
 Reserve Problems Chapter 11 Section 2 Problem 1 The department of health studied the number of patients who need liver transplantation. The following data are the Liver Transplantation Waiting List (LTWL), where y is the size (in number of patients) and x is the corresponding year: y | 12521784 3067 4071 50627062 | 7916 7825 8093 8728 8758 8934 9236 * 2000 2001 2002 2003 2004 2005 2006 2007 2008 2009 2010 2011 2012 Round your intermediate answers to four...
Reserve Problems Chapter 11 Section 2 Problem 1 The department of health studied the number of...
 Reserve Problems Chapter 11 Section 2 Problem 1 The department of health studied the number of patients who need liver transplantation. The following data are the Liver Transplantation Waiting List (LTWL), where y is the size (in number of patients) and x is the corresponding year: y 1393 1828 2764 3672 4682 6698 7444 7341 7498 8127 8218 8354 8663 * 2000 2001 2002 2003 2004 2005 2006 2007 2008 2009 2010 2011 2012 Round your intermediate answers to four...
Reserve Problems Chapter 11 Section 2 Problem 1 The department of health studied the number of...
 Reserve Problems Chapter 11 Section 2 Problem 1 The department of health studied the number of patients who need liver transplantation. The following data are the Liver Transplantation Waiting List (LTWL), where y is the size (in number of patients) and x is the corresponding year: y 1494 2092 31374094 5125 7061 7958 788279838763 8775 88369275 * 2003 2004 2005 2006 2007 2008 2009 2010 2011 2012 2013 2014 2015 Round your intermediate answers to four decimal places (e.g. 98.7654)....
Reserve Problems Chapter 11 Section 2 Problem 1 The department of health studied the number of...
 Reserve Problems Chapter 11 Section 2 Problem 1 The department of health studied the number of patients who need liver transplantation. The following data are the Liver Transplantation Waiting List (LTWL), where y is the size (in number of patients) and x is the corresponding year: y 1447 1873 3161 4127 5155 | 7190802579258181 8823 8925 90049421 x2005 2006 2007 2008 2009 2010 2011 2012 2013 2014 2015 2016 2017 Round your intermediate answers to four decimal places (e.g. 98.7654)....
 7.9 3.3 2. Consider the following data from 2001 - 2017, column 1 is the year, the 2nd column is the unemployment rate, and the 3rd column is the inflation rate. Plot the data using a scatter plot and argue whether in your opinion, the Phillips Curve has validity. 2001 5.7 1.6 2002 6.0 2.4 2003 5.7 2004 2005 2006 2007 2008 2009 2010 2011 2012 2013 2014 2015 2016 2017 4.1 3.0 0.7
 Reserve Problems Chapter 11 Section 2 Problem 1 The department of health studied the number of patients who need liver transplantation. The following data are the Liver Transplantation Waiting List (LTWL), where y is the size (in number of patients) and x is the corresponding year: 1351 17802741 384047616737744373667597821082068423 8889 * 2000 2001 2002 2003 2004 2005 2006 2007 2008 2009 2010 2011 2012 Round your intermediate answers to four decimal places (e.g. 98.7654). (a) Fit the simple linear regression...
 Reserve Problems Chapter 11 Section 2 Problem 1 The department of health studied the number of patients who need liver transplantation. The following data are the Liver Transplantation Waiting List (LTL), where is the site in number of patients) and is the corresponding year: 1303 1807 2819 3802 4783 6716 749974357658 8354 8430 84948938 * 2003 2004 2005 2006 2007 2008 2009 2010 2011 2012 2013 2014 2015 Round your intermediate answers to four decimal places (e.p.98.7654) (a) Fit the...
 Reserve Problems Chapter 11 Section 2 Problem 1 The department of health studied the number of patients who need liver transplantation. The following data are the Liver Transplantation Waiting List (LTWL), where y is the size (in number of patients) and x is the corresponding year: y | 12521784 3067 4071 50627062 | 7916 7825 8093 8728 8758 8934 9236 * 2000 2001 2002 2003 2004 2005 2006 2007 2008 2009 2010 2011 2012 Round your intermediate answers to four...
 Reserve Problems Chapter 11 Section 2 Problem 1 The department of health studied the number of patients who need liver transplantation. The following data are the Liver Transplantation Waiting List (LTWL), where y is the size (in number of patients) and x is the corresponding year: y 1393 1828 2764 3672 4682 6698 7444 7341 7498 8127 8218 8354 8663 * 2000 2001 2002 2003 2004 2005 2006 2007 2008 2009 2010 2011 2012 Round your intermediate answers to four...
 Reserve Problems Chapter 11 Section 2 Problem 1 The department of health studied the number of patients who need liver transplantation. The following data are the Liver Transplantation Waiting List (LTWL), where y is the size (in number of patients) and x is the corresponding year: y 1494 2092 31374094 5125 7061 7958 788279838763 8775 88369275 * 2003 2004 2005 2006 2007 2008 2009 2010 2011 2012 2013 2014 2015 Round your intermediate answers to four decimal places (e.g. 98.7654)....
 Reserve Problems Chapter 11 Section 2 Problem 1 The department of health studied the number of patients who need liver transplantation. The following data are the Liver Transplantation Waiting List (LTWL), where y is the size (in number of patients) and x is the corresponding year: y 1447 1873 3161 4127 5155 | 7190802579258181 8823 8925 90049421 x2005 2006 2007 2008 2009 2010 2011 2012 2013 2014 2015 2016 2017 Round your intermediate answers to four decimal places (e.g. 98.7654)....
Most questions answered within 3 hours.
-
D. A student completed 20 courses in the School of Arts and
Sciences. Her grades in...
asked 56 minutes ago -
teo
pucks moving on a frictionless air table are about to collide. the
1.5 kg puck...
asked 1 hour ago -
Problem #1
The area between Z = 0 and Z = 2.50
The area between Z...
asked 2 hours ago -
1. What is the meaning of the term communication style?
2. What are the benefits to...
asked 2 hours ago -
9.) You are buying a car that cost $26,500. You make payments of
$412 each month...
asked 2 hours ago -
. Suppose a discrete random variable has probability
distribution
P(x) = .2 if x = 0...
asked 3 hours ago -
Under the influence of its drive force, a snowmobile is moving
at a constant velocity along...
asked 4 hours ago -
Why do organizations decline? What steps can top
management take to halt, decline, and restore organizational...
asked 3 hours ago -
What mechanisms Drive speciation??
(I.e. what was Dawins theory on the orgin of species, and how...
asked 5 hours ago -
The manager at a car assembly plant believes that the mean
assembly time for a car...
asked 6 hours ago -
Which of the following is true of electron capture?
A) It decreases the nuclide's mass number...
asked 7 hours ago -
Assuming an efficiency of 43.10%, calculate the actual yield of
magnesium nitrate formed from 114.9 g...
asked 8 hours ago