The following time series shows the number of units of a particular product sold over the past six months.

a. Use  = 0.2 to compute the exponential smoothing values for the time
series, forecast the sales volume for month 7, and fill in the
unknown spaces.
= 0.2 to compute the exponential smoothing values for the time
series, forecast the sales volume for month 7, and fill in the
unknown spaces.
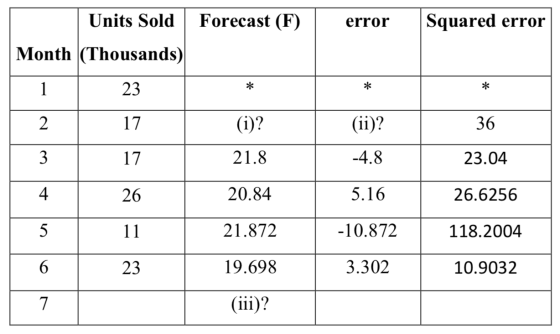
Compute the number (i):
Compute the number (ii):
Compute the number (iii):
What is the mean square error (MSE)?
b. Consider the following 3-month moving average for the above time series and forecasting the sales volume for month 7.

Compute the number (i):
Compute the number (ii):
Compute the number (iii):
Compute the number (iv):
What is the mean square error (MSE)?
Homework Answers


Add Answer to:
The following time series shows the number of units of a
particular product sold over the...
Question 3 part a & b. please show work! 3. The following time series shows the...
 Question 3 part a & b. please show work!
3. The following time series shows the number of units of a particular product sold over the past six months. Units Sold Month (Thousands) 23 2 17 3 17 4 5 26 11 23 6 a. Use a = 0.2 to compute the exponential smoothing values for the time series, forecast the sales volume for month 7, and fill in the unknown spaces. Units Sold Forecast (F) error Squared error Month...
Question 3 part a & b. please show work!
3. The following time series shows the number of units of a particular product sold over the past six months. Units Sold Month (Thousands) 23 2 17 3 17 4 5 26 11 23 6 a. Use a = 0.2 to compute the exponential smoothing values for the time series, forecast the sales volume for month 7, and fill in the unknown spaces. Units Sold Forecast (F) error Squared error Month...
Question 2 A-E. 1 Q2. The following time series shows the number of units of a...
 Question 2 A-E.
1 Q2. The following time series shows the number of units of a product sold over the past six months. Units Sold Month (Thousands) 9 2 3 3 6 4 6 5 12 6 9 Consider the following 3-month moving average for the above time series and forecast the sales volume for month 7. Month Units Sold 3-month moving (Thousands) average Forecast (F) error Squared Error 9 * * ذرا * * * * ** 2 3...
Question 2 A-E.
1 Q2. The following time series shows the number of units of a product sold over the past six months. Units Sold Month (Thousands) 9 2 3 3 6 4 6 5 12 6 9 Consider the following 3-month moving average for the above time series and forecast the sales volume for month 7. Month Units Sold 3-month moving (Thousands) average Forecast (F) error Squared Error 9 * * ذرا * * * * ** 2 3...
Based on the time series values from problem number 2, consider the following table of exponential...
Based on the time series values from problem number 2, consider the following table of exponential smoothing values using ? = ?. ? for the time series. Month Units Sold (Thousands) Forecast (F) error Squared error 1 9 * * * 2 3 (i)? (ii)? 36 3 6 7.2000 -1.2000 1.44 4 6 6.8400 -0.8400 0.7056 5 12 6.5880 5.4120 29.2897 6 9 8.2116 0.7884 0.6216 7 (iii)? a) b) c) d) e) a. Compute the number (i): Show your...
Q3. error Based on the time series values from problem number 2, consider the following table...
 Q3. error Based on the time series values from problem number 2, consider the following table of exponential smoothing values using a = 0.3 for the time series. Units Sold Forecast (F) Squared error Month (Thousands) 9 2 3 (0)? (ii)? 36 3 6 7.2000 -1.2000 1.44 4 6 6.8400 -0.8400 0.7056 5 12 6.5880 5.4120 29.2897 6 9 8.2116 0.7884 0.6216 7 (iii)? a) (3pt) Compute the number (i): Show your work for full credit b) (3pt) Compute the...
Q3 A-E Q3. Based on the time series values from problem number 2, consider the following...
 Q3
A-E
Q3. Based on the time series values from problem number 2, consider the following table of exponential smoothing values using a = 0.3 for the time series. Units Sold Forecast (F) error Month (Thousands) Squared error 9 2 3 (i)? (ii)? 36 6 7.2000 -1.2000 1.44 4 6 6.8400 -0.8400 0.7056 5 12 6.5880 5.4120 29.2897 6 9 8.2116 0.7884 0.6216 7 (iii)? 3 a) (3pt) Compute the number (i): Show your work for full credit b) (3pt)...
Q3
A-E
Q3. Based on the time series values from problem number 2, consider the following table of exponential smoothing values using a = 0.3 for the time series. Units Sold Forecast (F) error Month (Thousands) Squared error 9 2 3 (i)? (ii)? 36 6 7.2000 -1.2000 1.44 4 6 6.8400 -0.8400 0.7056 5 12 6.5880 5.4120 29.2897 6 9 8.2116 0.7884 0.6216 7 (iii)? 3 a) (3pt) Compute the number (i): Show your work for full credit b) (3pt)...
Q3 A-E Q3. Based on the time series values from problem number 2, consider the following...
 Q3 A-E
Q3. Based on the time series values from problem number 2, consider the following table of exponential smoothing values using a = 0.3 for the time series. Forecast (F) error Squared error Month Units Sold (Thousands) 9 * 1 2 برا برا 6 6 4 5 (i)? 7.2000 6.8400 6.5880 8.2116 (iii)? (ii)? -1.2000 -0.8400 5.4120 0.7884 36 1.44 0.7056 29.2897 0.6216 12 9 6 7 a) (3pt) Compute the number (i): Show your work for full credit...
Q3 A-E
Q3. Based on the time series values from problem number 2, consider the following table of exponential smoothing values using a = 0.3 for the time series. Forecast (F) error Squared error Month Units Sold (Thousands) 9 * 1 2 برا برا 6 6 4 5 (i)? 7.2000 6.8400 6.5880 8.2116 (iii)? (ii)? -1.2000 -0.8400 5.4120 0.7884 36 1.44 0.7056 29.2897 0.6216 12 9 6 7 a) (3pt) Compute the number (i): Show your work for full credit...
- + Fit to page ID Page view A) Read alouc * Q3. Based on the...
 - + Fit to page ID Page view A) Read alouc * Q3. Based on the time series values from problem number 2, consider the following table of exponential smoothing values using a = 0.3 for the time series. Units Sold Forecast (F) error Month (Thousands) Squared error 9 2 3 (i)? (ii)? 36 3 6 7.2000 -1.2000 1.44 4 6 6.8400 -0.8400 0.7056 5 12 6.5880 5.4120 29.2897 6 9 8.2116 0.7884 0.6216 (iii)? 1 7 a) (3pt) Compute...
Consider the following time series data. Week 1 2 3 4 5 6 Value 17 13...
 Consider the following time series data.
Week
1
2
3
4
5
6
Value
17
13
15
11
15
13
(a)
Choose the correct time series plot.
(i)
(ii)
(iii)
(iv)
- Select your answer -Graph (i)Graph (ii)Graph (iii)Graph
(iv)Item 1
What type of pattern exists in the data?
- Select your answer -Horizontal PatternTrend PatternItem
2
(b)
Develop a three-week moving average for this time series.
Compute MSE and a forecast for week 7.
If required, round your answers...
Consider the following time series data.
Week
1
2
3
4
5
6
Value
17
13
15
11
15
13
(a)
Choose the correct time series plot.
(i)
(ii)
(iii)
(iv)
- Select your answer -Graph (i)Graph (ii)Graph (iii)Graph
(iv)Item 1
What type of pattern exists in the data?
- Select your answer -Horizontal PatternTrend PatternItem
2
(b)
Develop a three-week moving average for this time series.
Compute MSE and a forecast for week 7.
If required, round your answers...
Problem II The following time series shows the sales of a clothing store over a 10-week...
 Problem II The following time series shows the sales of a clothing store over a 10-week period. Week Sales ($1,000s) 15 a. Compute a 4-week moving average for the above time series. b. Compute the mean square error (MSE) and mean Absolut deviation (MAD) for the 4. week moving average forecast. c. Use a -0.3 to compute the exponential smoothing values and MSE and MAD for the time series. d. Forecast sales for week 11. e. Which model is the...
Omework Consider the following time series data Month 1 2 3 4 5 6 7 Value 21 14 18 13 18 21 14 a....
 omework Consider the following time series data Month 1 2 3 4 5 6 7 Value 21 14 18 13 18 21 14 a. Which of the following is a correct time series plot for this data? や" -Select your answer- What type of pattern exists in the data? -select your answer- b. Develop the three-month moving average forecasts for this time series. Compute MSE and a forecast for month 8 (to 2 decimals if necessary). Enter negative values as...
 Question 3 part a & b. please show work!
3. The following time series shows the number of units of a particular product sold over the past six months. Units Sold Month (Thousands) 23 2 17 3 17 4 5 26 11 23 6 a. Use a = 0.2 to compute the exponential smoothing values for the time series, forecast the sales volume for month 7, and fill in the unknown spaces. Units Sold Forecast (F) error Squared error Month...
Question 3 part a & b. please show work!
3. The following time series shows the number of units of a particular product sold over the past six months. Units Sold Month (Thousands) 23 2 17 3 17 4 5 26 11 23 6 a. Use a = 0.2 to compute the exponential smoothing values for the time series, forecast the sales volume for month 7, and fill in the unknown spaces. Units Sold Forecast (F) error Squared error Month...
 Question 2 A-E.
1 Q2. The following time series shows the number of units of a product sold over the past six months. Units Sold Month (Thousands) 9 2 3 3 6 4 6 5 12 6 9 Consider the following 3-month moving average for the above time series and forecast the sales volume for month 7. Month Units Sold 3-month moving (Thousands) average Forecast (F) error Squared Error 9 * * ذرا * * * * ** 2 3...
Question 2 A-E.
1 Q2. The following time series shows the number of units of a product sold over the past six months. Units Sold Month (Thousands) 9 2 3 3 6 4 6 5 12 6 9 Consider the following 3-month moving average for the above time series and forecast the sales volume for month 7. Month Units Sold 3-month moving (Thousands) average Forecast (F) error Squared Error 9 * * ذرا * * * * ** 2 3...
 Q3. error Based on the time series values from problem number 2, consider the following table of exponential smoothing values using a = 0.3 for the time series. Units Sold Forecast (F) Squared error Month (Thousands) 9 2 3 (0)? (ii)? 36 3 6 7.2000 -1.2000 1.44 4 6 6.8400 -0.8400 0.7056 5 12 6.5880 5.4120 29.2897 6 9 8.2116 0.7884 0.6216 7 (iii)? a) (3pt) Compute the number (i): Show your work for full credit b) (3pt) Compute the...
 Q3
A-E
Q3. Based on the time series values from problem number 2, consider the following table of exponential smoothing values using a = 0.3 for the time series. Units Sold Forecast (F) error Month (Thousands) Squared error 9 2 3 (i)? (ii)? 36 6 7.2000 -1.2000 1.44 4 6 6.8400 -0.8400 0.7056 5 12 6.5880 5.4120 29.2897 6 9 8.2116 0.7884 0.6216 7 (iii)? 3 a) (3pt) Compute the number (i): Show your work for full credit b) (3pt)...
Q3
A-E
Q3. Based on the time series values from problem number 2, consider the following table of exponential smoothing values using a = 0.3 for the time series. Units Sold Forecast (F) error Month (Thousands) Squared error 9 2 3 (i)? (ii)? 36 6 7.2000 -1.2000 1.44 4 6 6.8400 -0.8400 0.7056 5 12 6.5880 5.4120 29.2897 6 9 8.2116 0.7884 0.6216 7 (iii)? 3 a) (3pt) Compute the number (i): Show your work for full credit b) (3pt)...
 Q3 A-E
Q3. Based on the time series values from problem number 2, consider the following table of exponential smoothing values using a = 0.3 for the time series. Forecast (F) error Squared error Month Units Sold (Thousands) 9 * 1 2 برا برا 6 6 4 5 (i)? 7.2000 6.8400 6.5880 8.2116 (iii)? (ii)? -1.2000 -0.8400 5.4120 0.7884 36 1.44 0.7056 29.2897 0.6216 12 9 6 7 a) (3pt) Compute the number (i): Show your work for full credit...
Q3 A-E
Q3. Based on the time series values from problem number 2, consider the following table of exponential smoothing values using a = 0.3 for the time series. Forecast (F) error Squared error Month Units Sold (Thousands) 9 * 1 2 برا برا 6 6 4 5 (i)? 7.2000 6.8400 6.5880 8.2116 (iii)? (ii)? -1.2000 -0.8400 5.4120 0.7884 36 1.44 0.7056 29.2897 0.6216 12 9 6 7 a) (3pt) Compute the number (i): Show your work for full credit...
 - + Fit to page ID Page view A) Read alouc * Q3. Based on the time series values from problem number 2, consider the following table of exponential smoothing values using a = 0.3 for the time series. Units Sold Forecast (F) error Month (Thousands) Squared error 9 2 3 (i)? (ii)? 36 3 6 7.2000 -1.2000 1.44 4 6 6.8400 -0.8400 0.7056 5 12 6.5880 5.4120 29.2897 6 9 8.2116 0.7884 0.6216 (iii)? 1 7 a) (3pt) Compute...
 Consider the following time series data.
Week
1
2
3
4
5
6
Value
17
13
15
11
15
13
(a)
Choose the correct time series plot.
(i)
(ii)
(iii)
(iv)
- Select your answer -Graph (i)Graph (ii)Graph (iii)Graph
(iv)Item 1
What type of pattern exists in the data?
- Select your answer -Horizontal PatternTrend PatternItem
2
(b)
Develop a three-week moving average for this time series.
Compute MSE and a forecast for week 7.
If required, round your answers...
Consider the following time series data.
Week
1
2
3
4
5
6
Value
17
13
15
11
15
13
(a)
Choose the correct time series plot.
(i)
(ii)
(iii)
(iv)
- Select your answer -Graph (i)Graph (ii)Graph (iii)Graph
(iv)Item 1
What type of pattern exists in the data?
- Select your answer -Horizontal PatternTrend PatternItem
2
(b)
Develop a three-week moving average for this time series.
Compute MSE and a forecast for week 7.
If required, round your answers...
 Problem II The following time series shows the sales of a clothing store over a 10-week period. Week Sales ($1,000s) 15 a. Compute a 4-week moving average for the above time series. b. Compute the mean square error (MSE) and mean Absolut deviation (MAD) for the 4. week moving average forecast. c. Use a -0.3 to compute the exponential smoothing values and MSE and MAD for the time series. d. Forecast sales for week 11. e. Which model is the...
 omework Consider the following time series data Month 1 2 3 4 5 6 7 Value 21 14 18 13 18 21 14 a. Which of the following is a correct time series plot for this data? や" -Select your answer- What type of pattern exists in the data? -select your answer- b. Develop the three-month moving average forecasts for this time series. Compute MSE and a forecast for month 8 (to 2 decimals if necessary). Enter negative values as...
Most questions answered within 3 hours.
-
You purchase your daily coffee at the Chemist’s Coffeehouse and
have a choice of two cups:...
asked 7 minutes ago -
Problem 16-51 Sales
Activity Variance (LO 16-3)Odessa, Inc., reports the following
information concerning operations for the...
asked 32 minutes ago -
Pictured on the right are thee point charges Q1 = 18.4 μC, Q2 =
-30.6 μC,...
asked 34 minutes ago -
A graduate student is conducting research in psychology and
needs to obtain the IQ scores of...
asked 1 hour ago -
R2.84: There are 2 defective products in a production lot of 10.
An inspector randomly selected...
asked 2 hours ago -
Consider the following equilibrium system: COCl2(g) CO(g) +
Cl2(g) A 10.00 L evacuated flask is filled...
asked 3 hours ago -
1) What are the two distinct steps that one needs to perform
when developing a data...
asked 3 hours ago -
2) Write a C++ program that uses a class called “Degree” to
obtain the trigonometric
values...
asked 4 hours ago -
1. In eukaryotic cells the genomes of
&
asked 4 hours ago -
The standard enthalpy of propanol (C3H7OH) is -303.0 kJ/mol.
Compute both of the
gross and net...
asked 4 hours ago -
Why PWM using H-bridge for control motor speed is more power
effiecient than the linear amplifier...
asked 4 hours ago -
In 1999, Carly Fiorina famously said,"I hope that we are at a
point that everyone is...
asked 4 hours ago