

Homework Answers
a)
i) Coefficient for Constant = 1.38*16.58 = 22.8804
ii) Coefficient for x1 = 0.231*7 = 1.617
---
b)
iii) df(Regression) = 1
iv) df(error) = 9-1 = 8
v) SSE = 3.10 - 2.12 = 0.98
---
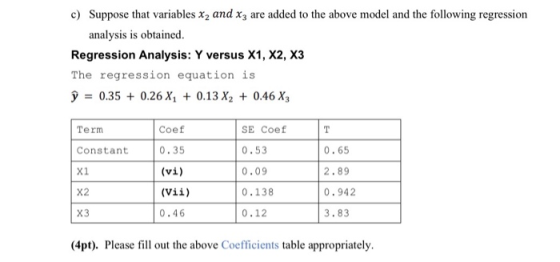
c)
vi) Coefficient for x1 = 0.09*2.89 = 0.26
vii) Coefficient for x2 = 0.138*0.942 = 0.13
---
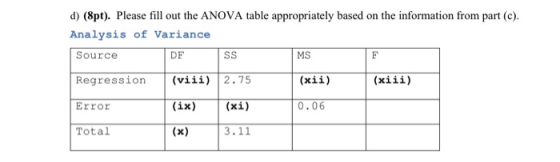
d)
viii) df(Regression) = 3
xi) SSE = 3.11 - 2.75 = 0.36
ix) df(error) = .36/.06 = 6
x) df(total) = 3+6 = 9
xii) MSR = 2.75/3 = 0.9167
xiii) F = MSR/MSE = .9167/.06 = 15.2778
| ANOVA | ||||
| df | SS | MS | F | |
| Regression | 3 | 2.75 | 0.9167 | 15.2778 |
| Residual | 6 | 0.36 | 0.06 | |
| Total | 9 | 3.11 |
Add Answer to:
question #1 A-D. Please show work.
Q1. The following Regression function has been developed to check...
Q1. The following Regression function has been developed to check the relationship between the dependent variable...
 Q1. The following Regression function has been developed to check the relationship between the dependent variable y and the independent variable xz. Consider the following Minitab output and answer the questions. Regression Equation 9 = 0.86 + 0.65 x a) (Apt). Please fill out the Coefficients table appropriately. Coefficients Term Coef SE Coef T-Value P-Value VIF Constant 0 1.38 16.58 0.000 X1 0.231 7.00 0.000 1.00 b) (4pt). Please fill out the ANOVA table appropriately. Analysis of Variance Source DF...
The following Regression function has been developed to check the relationship between the dependent variable y...
 The following Regression function has been developed to check
the relationship between the dependent variable y and the
independent variable ?1 .
Consider the following Minitab output and answer the
questions.
Regression Equation
?̂ = ? . ? ? + ? . ? ? x1
a) Please fill out the Coefficients table appropriately.
b) Please fill out the ANOVA table appropriately.
c) Suppose that variables ?2 ??? ?3 are added to the above model
and the following regression analysis is...
The following Regression function has been developed to check
the relationship between the dependent variable y and the
independent variable ?1 .
Consider the following Minitab output and answer the
questions.
Regression Equation
?̂ = ? . ? ? + ? . ? ? x1
a) Please fill out the Coefficients table appropriately.
b) Please fill out the ANOVA table appropriately.
c) Suppose that variables ?2 ??? ?3 are added to the above model
and the following regression analysis is...
The regression of height (measured in inches) and gender (male 1 and female-O) on lung volume...
 The regression of height (measured in inches) and gender (male 1 and female-O) on lung volume (FEV, measured in liters) had the following ANOVA table: Regression Analysis: FEV Versus Hgt, Sex DF Adj SSAdj MS F-Value P-Value 0.000 0.000 0.000 Source Regression 2 372.479 186.239 1023.65 1 351.155 351.155 1930.09 1 Hgt Sex Error Total 13.70 2.493 651 118.441 653 490.920 2.493 0.182 R-sq (adj) 75.80 0.426541 75. 87 Coefficients Term Constant Hgt Sex Coef SE Coef T-Value P-Value 0.000...
Demonstrate regression diagnostics, variables selection and validation.
A hospital administration wished to study the relation between patient satisfaction (Y) and patient’s age (X1), severity of illness (X2) and anxiety level. The administration randomly selected 15 patients and the results of the study are shown below. The regression equation isy = 184 - 0.976 x1 - 1.14 x2 - 12.3 x3 Predictor Coef SE Coef T Constant 184.02 31.70 5.81 x1 -0.9763 0.4500 -2.17 x2 -1.1361 0.9786 -1.16 x3 -12.34 14.30 -0.86 S = 11.0529 R-Sq = 70.2% ...
' - [2 marks] Suppose that we want to find a regression equation relating systolic blood...
 '
- [2 marks] Suppose that we want to find a regression equation relating systolic blood pressure (v) to weight (x1), age (x2) and smoking status (0 = does not smoke, 1 = smokes less than one pack per day, 2 = smokes one or more packs per day). Use the Minitab outputs below to test whether or not the smoking status variable adds to the predictive value of a model which already contains weight and age, using a =...
'
- [2 marks] Suppose that we want to find a regression equation relating systolic blood pressure (v) to weight (x1), age (x2) and smoking status (0 = does not smoke, 1 = smokes less than one pack per day, 2 = smokes one or more packs per day). Use the Minitab outputs below to test whether or not the smoking status variable adds to the predictive value of a model which already contains weight and age, using a =...
1. A multiple regression analysis between yearly income (Y in $1,000s), college grade point average (X1),...
1. A multiple regression analysis between yearly income (Y in $1,000s), college grade point average (X1), age of the individuals (X2), and the gender of the individual (X3; zero representing female and one representing male) was performed on a sample of ten students, and the following results were obtained: Coefficients Standard Error p-value Intercept 4.0928 1.4400 X1 10.0230 1.6512 X2 0.1020 0.1225 X3 ‐4.4811 1.4400 ANOVA DF SS MS Regression 360.59 Residual error 23.91 a. Write the regression...
Regression Analysis: Rating versus Shelf position Method Categorical predictor coding (1, 0) Analysis of Variance Source...
Regression Analysis: Rating versus Shelf position Method Categorical predictor coding (1, 0) Analysis of Variance Source DF Adj SS Adj MS F-Value P-Value Regression 2 1511 755.6 5.50 0.013 Shelf position 2 1511 755.6 5.50 0.013 Error 20 2748 137.4 Total 22 4259 Model Summary S R-sq R-sq(adj) R-sq(pred) 11.7222 35.48% 29.03% 21.34% Coefficients Term Coef SE Coef T-Value P-Value VIF Constant 32.85 4.43 7.41 0.000 Shelf position bottom 7.40 7.35 1.01 0.326 1.30 top 18.15 5.58 3.26 0.004 1.30...
Suppose that we want to find a regression equation relating systolic blood pressure (y) to weight...
Suppose that we want to find a regression equation relating systolic blood pressure (y) to weight (x1), age (x2) and smoking status (0 = does not smoke, 1 = smokes less than one pack per day, 2 = smokes one or more packs per day). Use the Minitab outputs below to test whether or not the smoking status variable adds to the predictive value of a model which already contains weight and age, using α = .05. i.e., test the...
 Q1. The following Regression function has been developed to check the relationship between the dependent variable y and the independent variable xz. Consider the following Minitab output and answer the questions. Regression Equation 9 = 0.86 + 0.65 x a) (Apt). Please fill out the Coefficients table appropriately. Coefficients Term Coef SE Coef T-Value P-Value VIF Constant 0 1.38 16.58 0.000 X1 0.231 7.00 0.000 1.00 b) (4pt). Please fill out the ANOVA table appropriately. Analysis of Variance Source DF...
 The following Regression function has been developed to check
the relationship between the dependent variable y and the
independent variable ?1 .
Consider the following Minitab output and answer the
questions.
Regression Equation
?̂ = ? . ? ? + ? . ? ? x1
a) Please fill out the Coefficients table appropriately.
b) Please fill out the ANOVA table appropriately.
c) Suppose that variables ?2 ??? ?3 are added to the above model
and the following regression analysis is...
The following Regression function has been developed to check
the relationship between the dependent variable y and the
independent variable ?1 .
Consider the following Minitab output and answer the
questions.
Regression Equation
?̂ = ? . ? ? + ? . ? ? x1
a) Please fill out the Coefficients table appropriately.
b) Please fill out the ANOVA table appropriately.
c) Suppose that variables ?2 ??? ?3 are added to the above model
and the following regression analysis is...
 The regression of height (measured in inches) and gender (male 1 and female-O) on lung volume (FEV, measured in liters) had the following ANOVA table: Regression Analysis: FEV Versus Hgt, Sex DF Adj SSAdj MS F-Value P-Value 0.000 0.000 0.000 Source Regression 2 372.479 186.239 1023.65 1 351.155 351.155 1930.09 1 Hgt Sex Error Total 13.70 2.493 651 118.441 653 490.920 2.493 0.182 R-sq (adj) 75.80 0.426541 75. 87 Coefficients Term Constant Hgt Sex Coef SE Coef T-Value P-Value 0.000...
 '
- [2 marks] Suppose that we want to find a regression equation relating systolic blood pressure (v) to weight (x1), age (x2) and smoking status (0 = does not smoke, 1 = smokes less than one pack per day, 2 = smokes one or more packs per day). Use the Minitab outputs below to test whether or not the smoking status variable adds to the predictive value of a model which already contains weight and age, using a =...
'
- [2 marks] Suppose that we want to find a regression equation relating systolic blood pressure (v) to weight (x1), age (x2) and smoking status (0 = does not smoke, 1 = smokes less than one pack per day, 2 = smokes one or more packs per day). Use the Minitab outputs below to test whether or not the smoking status variable adds to the predictive value of a model which already contains weight and age, using a =...
Most questions answered within 3 hours.
-
Find the expected count and the contribution to the chi-square
statistic for the (Group 1, No)...
asked 1 hour ago -
Suppose you are purchasing a meal and with every meal a you
receive one of 10...
asked 1 hour ago -
A 75.0 kg 0erson is riding in a car moving at 20.0 m/s when the
car...
asked 1 hour ago -
What does Δp = QR mean in words?
Pushing a viscous fluid through a pipe requires...
asked 1 hour ago -
We know that system.out.println (“object number” + n ); is
legal.String name; int n; name =...
asked 1 hour ago -
Come up with a real-life problem (open-ended) and solve it by
designing and writing a Java...
asked 1 hour ago -
Power Music owns five music stores, where it sells music,
instruments, and supplies. In addition, it...
asked 1 hour ago -
True or false and
why:
Given the following sequence of numbers to be
inserted {4,5,6,1,2,3,8,7}, the...
asked 1 hour ago -
Code using Java
What is an interface? Complete the following code:
interface IExample{
public void print();...
asked 1 hour ago -
Bob Nale is the owner of Nale’s Quick Fill. Bob would like to
estimate the mean...
asked 2 hours ago -
what are your opinions on environmental rights and absolute bans
?
asked 2 hours ago -
benzene melts at 5.5 degrees c if the vapor pressure of liquid
benzene is 19.2 kOa...
asked 2 hours ago