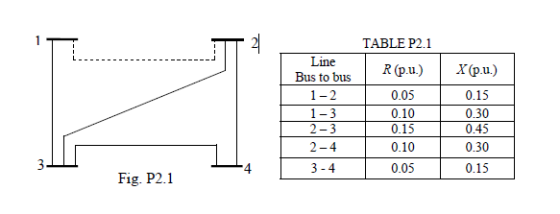
2. The Fig. P2.1 shows the one-line diagram of a simple four-bus
system. Table P2.1
gives the line impedances identified by the buses on which these
terminate. The
shunt admittance at all the buses is assumed negligible
(a) Convert the network impedances to admittances.
(b) Obtain the bus admittance YBUS assuming that the line shown
dotted is not
connected.
(c) (i) What modifications need to be carried out in YBUS if the
dotted line is
now connected.
(ii) Obtain the new YBUS.
Homework Answers


Add Answer to:
2. The Fig. P2.1 shows the one-line diagram of a simple four-bus
system. Table P2.1
gives...
The Fig. P2.1 shows the one-line diagram of a simple four-bus system. Table P2.1 gives the...
 The Fig. P2.1 shows the one-line diagram of a simple four-bus system. Table P2.1 gives the line impedances identified by the buses on which these terminate. The shunt admittance at all the buses is assumed negligible (a) Obtain the bus admittance Ygus assuming that the line shown dotted is not connected (b) (i) What modifications need to be carried out in「BUs If the dotted line is now connected? The impedance of the line is (0.01 +j0.1) pu (ii) obtain the...
Question1 A power system is shown in figure below. The generators at buses 1 and 2...
 Question1 A power system is shown in figure below. The generators at buses 1 and 2 are represented by their equivalent voltage and current sources wh their reactances in per unit respectively. The lines are represented by π model where series reactances and shunt reactances are also expressed in per unit. (a) Convert network impedances to admittances. (b) Obtain the Ybus (i.e., bus admittance matrix) by inspection. 0.4 /0.5 G1 0.2 0.25 0.3 0.15 4
Consider the impedance diagram of a simple energy distribution network seen in fig. 1. The transmission...
 Consider the impedance diagram of a simple energy distribution network seen in fig. 1. The transmission lines that connect the buses have the line impedances as shown in the figure. The generators connected to buses 1 and 2 are known to be E1=1.0 pu (per unit) and E2=0.5 pu, respectively, on a 1 MV base. a) (05) Draw the admittance diagram for the system shown in fig. 1. b) (10) Obtain the bus admittance matrix Ybus for the system. c)...
2. Consider the three-bus system shown in Fig. P2.1 with 1 Lj02 pu the per unit line reactances i...
 Please Write clearly
2. Consider the three-bus system shown in Fig. P2.1 with 1 Lj02 pu the per unit line reactances indicated on the figure. The magnitude of all the three-bus voltages are specified to be 1.0 pu. The bus powers are specified in the Table P2.1. 0.2 pu Fig. P2.1 Table P2.1 Reactive Demand Demand Generation Reactive Generation ea Real Gi (Unspecified) 1 PDI 1.0 DI 0.6 PGI? 2 PD2- 0 D2-0 PG2.4G2 (Unspecified) 3 PD3-1.0 D3 .0 PG30...
Please Write clearly
2. Consider the three-bus system shown in Fig. P2.1 with 1 Lj02 pu the per unit line reactances indicated on the figure. The magnitude of all the three-bus voltages are specified to be 1.0 pu. The bus powers are specified in the Table P2.1. 0.2 pu Fig. P2.1 Table P2.1 Reactive Demand Demand Generation Reactive Generation ea Real Gi (Unspecified) 1 PDI 1.0 DI 0.6 PGI? 2 PD2- 0 D2-0 PG2.4G2 (Unspecified) 3 PD3-1.0 D3 .0 PG30...
The single-line diagram of a three-phase five-bus power system is shown in Fig.1. All lines have ...
 The single-line diagram of a three-phase five-bus power system is shown in Fig.1. All lines have an impedance 0.0099+0.0990j pu. Line charging (capacitive) admittance can be neglected. 2-0.8830 30.2076 SD3-0.2+j0.1 SD3-1.7137+j0.5983 Sos-1.7355+j0.5496 Pe5 -0.5 G Qg5 -0.2 Fig. 1 a) Find the Ybus matrix of this system. b) Classify the buses in this system as slack, PV or PQ bus c) For each bus, state the given and unknown power flow variables. d) Find the net power injection (scheduled power)...
The single-line diagram of a three-phase live-bus power system is shown in Fig. 1. All lines...
 The single-line diagram of a three-phase live-bus power system is shown in Fig. 1. All lines have an impedance 0.0099 + 0.0990j pu. Line charging admittance can be neglected. a) Find the Ybus matrix of this system. b) Classify the buses in this system as slack, PV or PQ bus. c) For each bus, state the given and unknown power how variables. d) Find the net power Injection (scheduled power) for buses 2, 3, 4, and 5.
The following figure shows the one-line diagram of a single power network which has the line...
 The following figure shows the one-line diagram of a single
power network which has the line admittances shown on the figure.
Each generator connected to buses 1 and 4 has a sub-transient
reactance of 0.25 pu. Determine for the network
a. Ybus
b. Zbus
c. The sub-transient current in per unit in a three-phase fault
on bus 3 and
d. The contributions to the fault current from line 1-3 and from
4-3
૩૦.૦૬૦-૬ ૬ . ૦૩72 , 30.23 90.0372૬ ૬૦.૦૦૩%...
The following figure shows the one-line diagram of a single
power network which has the line admittances shown on the figure.
Each generator connected to buses 1 and 4 has a sub-transient
reactance of 0.25 pu. Determine for the network
a. Ybus
b. Zbus
c. The sub-transient current in per unit in a three-phase fault
on bus 3 and
d. The contributions to the fault current from line 1-3 and from
4-3
૩૦.૦૬૦-૬ ૬ . ૦૩72 , 30.23 90.0372૬ ૬૦.૦૦૩%...
The one-line diagram of a simple power system is shown in Figure 1. The neutral of...
 The one-line diagram of a simple power system is shown in Figure 1. The neutral of each generator is grounded through a current-limiting reactor of 0.25/3 per unit on a 100-MVA base. The system data expressed in per unit on a common 100-MVA base is tabulated below. The generators are running on no-load at their rated voltage and rated frequency with their emfs in phase. Determine the fault current for the following faults giving Zo = 0.35, Z = 0.22...
Figure 1 shows the one line diagram of a simple power system. Generators are connected at...
 Figure 1 shows the one line diagram of a simple power system. Generators are connected at buses 1 and 3 while the loads are indicated at all five buses. Base values for transmission system are 100 MVA, 138 kV. The line data of Table 1 gives per unit series impedances and the charging MVar accounting for the distributed capacitance of the 5 lines. The bus data in Table 2 list values for P, Q and Vat each bus. The slack...
Q2. i) The one-line diagram of simple three-bus power system with generation at bus 1 is shown in figure Q2. 0.02 + 30.04 2 256.6 MW 0.0125 + 30.025 +110.2 Mvar 0.01 + 30.03 Slack Bus 3 Vi = 1.0520° 138.6 MW 45.2 Mvar Figure Q2 The magnitude of voltage at
Q2. i) The one-line diagram of simple three-bus power system with generation at bus 1 is shown in figure Q2. 0.02 + 30.04 2 256.6 MW 0.0125 + 30.025 +110.2 Mvar 0.01 + 30.03 Slack Bus 3 Vi = 1.0520° 138.6 MW 45.2 Mvar Figure Q2 The magnitude of voltage at bus 1 is adjusted to 1.05 per unit. The scheduled loads at buses 2 and 3 are as marked on the diagram. Line impedances are marked in per unit...
 The Fig. P2.1 shows the one-line diagram of a simple four-bus system. Table P2.1 gives the line impedances identified by the buses on which these terminate. The shunt admittance at all the buses is assumed negligible (a) Obtain the bus admittance Ygus assuming that the line shown dotted is not connected (b) (i) What modifications need to be carried out in「BUs If the dotted line is now connected? The impedance of the line is (0.01 +j0.1) pu (ii) obtain the...
 Question1 A power system is shown in figure below. The generators at buses 1 and 2 are represented by their equivalent voltage and current sources wh their reactances in per unit respectively. The lines are represented by π model where series reactances and shunt reactances are also expressed in per unit. (a) Convert network impedances to admittances. (b) Obtain the Ybus (i.e., bus admittance matrix) by inspection. 0.4 /0.5 G1 0.2 0.25 0.3 0.15 4
 Consider the impedance diagram of a simple energy distribution network seen in fig. 1. The transmission lines that connect the buses have the line impedances as shown in the figure. The generators connected to buses 1 and 2 are known to be E1=1.0 pu (per unit) and E2=0.5 pu, respectively, on a 1 MV base. a) (05) Draw the admittance diagram for the system shown in fig. 1. b) (10) Obtain the bus admittance matrix Ybus for the system. c)...
 Please Write clearly
2. Consider the three-bus system shown in Fig. P2.1 with 1 Lj02 pu the per unit line reactances indicated on the figure. The magnitude of all the three-bus voltages are specified to be 1.0 pu. The bus powers are specified in the Table P2.1. 0.2 pu Fig. P2.1 Table P2.1 Reactive Demand Demand Generation Reactive Generation ea Real Gi (Unspecified) 1 PDI 1.0 DI 0.6 PGI? 2 PD2- 0 D2-0 PG2.4G2 (Unspecified) 3 PD3-1.0 D3 .0 PG30...
Please Write clearly
2. Consider the three-bus system shown in Fig. P2.1 with 1 Lj02 pu the per unit line reactances indicated on the figure. The magnitude of all the three-bus voltages are specified to be 1.0 pu. The bus powers are specified in the Table P2.1. 0.2 pu Fig. P2.1 Table P2.1 Reactive Demand Demand Generation Reactive Generation ea Real Gi (Unspecified) 1 PDI 1.0 DI 0.6 PGI? 2 PD2- 0 D2-0 PG2.4G2 (Unspecified) 3 PD3-1.0 D3 .0 PG30...
 The single-line diagram of a three-phase five-bus power system is shown in Fig.1. All lines have an impedance 0.0099+0.0990j pu. Line charging (capacitive) admittance can be neglected. 2-0.8830 30.2076 SD3-0.2+j0.1 SD3-1.7137+j0.5983 Sos-1.7355+j0.5496 Pe5 -0.5 G Qg5 -0.2 Fig. 1 a) Find the Ybus matrix of this system. b) Classify the buses in this system as slack, PV or PQ bus c) For each bus, state the given and unknown power flow variables. d) Find the net power injection (scheduled power)...
 The single-line diagram of a three-phase live-bus power system is shown in Fig. 1. All lines have an impedance 0.0099 + 0.0990j pu. Line charging admittance can be neglected. a) Find the Ybus matrix of this system. b) Classify the buses in this system as slack, PV or PQ bus. c) For each bus, state the given and unknown power how variables. d) Find the net power Injection (scheduled power) for buses 2, 3, 4, and 5.
 The following figure shows the one-line diagram of a single
power network which has the line admittances shown on the figure.
Each generator connected to buses 1 and 4 has a sub-transient
reactance of 0.25 pu. Determine for the network
a. Ybus
b. Zbus
c. The sub-transient current in per unit in a three-phase fault
on bus 3 and
d. The contributions to the fault current from line 1-3 and from
4-3
૩૦.૦૬૦-૬ ૬ . ૦૩72 , 30.23 90.0372૬ ૬૦.૦૦૩%...
The following figure shows the one-line diagram of a single
power network which has the line admittances shown on the figure.
Each generator connected to buses 1 and 4 has a sub-transient
reactance of 0.25 pu. Determine for the network
a. Ybus
b. Zbus
c. The sub-transient current in per unit in a three-phase fault
on bus 3 and
d. The contributions to the fault current from line 1-3 and from
4-3
૩૦.૦૬૦-૬ ૬ . ૦૩72 , 30.23 90.0372૬ ૬૦.૦૦૩%...
 The one-line diagram of a simple power system is shown in Figure 1. The neutral of each generator is grounded through a current-limiting reactor of 0.25/3 per unit on a 100-MVA base. The system data expressed in per unit on a common 100-MVA base is tabulated below. The generators are running on no-load at their rated voltage and rated frequency with their emfs in phase. Determine the fault current for the following faults giving Zo = 0.35, Z = 0.22...
 Figure 1 shows the one line diagram of a simple power system. Generators are connected at buses 1 and 3 while the loads are indicated at all five buses. Base values for transmission system are 100 MVA, 138 kV. The line data of Table 1 gives per unit series impedances and the charging MVar accounting for the distributed capacitance of the 5 lines. The bus data in Table 2 list values for P, Q and Vat each bus. The slack...
Most questions answered within 3 hours.
-
When might an index slow down the overall performance of the
database? Choose the best answer....
asked 3 minutes ago -
Due to a recession, expected inflation this year is only 2.25%.
However, the inflation rate in...
asked 5 minutes ago -
Write four functions: (IN PYTHON 3)
1) bound(l) - given a list of integers l, compute...
asked 7 minutes ago -
A quarterback throws a football. When the football leaves his
hand, it has a horizontal velocity...
asked 15 minutes ago -
he term "reproductive isolation mechanism" refers to
inability of a species to continue reproduction
specific areas...
asked 17 minutes ago -
In a certain binary-star system, each star has the same mass
which is 4.4 times of...
asked 21 minutes ago -
Use the model of the small open economy (Apply the small
open economy model of real...
asked 29 minutes ago -
The structure Car is declared as follows: struct Car { string
carMake; string carModel; int yearModel;...
asked 38 minutes ago -
Consider a transformer with 125 turns of wire in the primary
winding and 1475 turns of...
asked 38 minutes ago -
Let h be the depth below the surface of the ocean at which the
absolute pressure...
asked 40 minutes ago -
Apply the four-stage New Product Development model shown in page
325 of your text book
(Concept...
asked 49 minutes ago -
An enzyme catalyzes the reaction A ⇌ B. The enzyme is present at
a concentration of...
asked 57 minutes ago