

Homework Answers
5. The 40 outcomes on rolling a dice are
3231346151515244634523236514125331454132
The sample mean of the observation is
= (sum of all the outcomes)/40
= 128/40
= 3.2
6. The value of  from question 2 is not known. The value from question 5 is
3.2.
from question 2 is not known. The value from question 5 is
3.2.
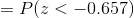
7. The probability that
takes a value less than 3.35 is


Thank You!! Please Upvote!!
Add Answer to:
5. Roll the die another 40 times and calculate the value of x. Sample Mean Observation...
1. Roll the die 40 times and record the rolled values in the table below. These...
 1. Roll the die 40 times and record the rolled values in the table below. These represent 40 observations of X. 2. Calculate the sample mean of your 40 rolls using Excel. This number represents a single observation of the random variable X (which, again, is a random variable representing the sample mean of 40 rolls of a die). Record the value for the sample mean in the space below: Sample Mean Observation (= first observation of X): 4. Do...
The random variable X represents the roll of a 10-sided fair die
The random variable X represents the roll of a 10-sided fair die. That is to say its sample space is the set {1,2,3,4,5,6,7,8,9,10}, with each outcome equally likely. Calculate the following population parameters: a.) The population mean: μx = _______ b.) The population variance and standard deviation: c.) The expected value E[X²] 9.) For the normal random variable X with mean μ = 50 and standard deviation σ = 4, a.) Find the probability P(x > 60) = b.) Find the probability (49 < x̄ <...
R commands 2) Illustrating the central limit theorem. X, X, X, a sequence of independent random variables with the same distribution as X. Define the sample mean X by X = A + A 2 be a random va...
 R commands
2) Illustrating the central limit theorem. X, X, X, a sequence of independent random variables with the same distribution as X. Define the sample mean X by X = A + A 2 be a random variable having the exponential distribution with A -2. Denote by -..- The central limit theorem applied to this particular case implices that the probability distribution of converges to the standard normal distribution for certain values of u and o (a) For what...
R commands
2) Illustrating the central limit theorem. X, X, X, a sequence of independent random variables with the same distribution as X. Define the sample mean X by X = A + A 2 be a random variable having the exponential distribution with A -2. Denote by -..- The central limit theorem applied to this particular case implices that the probability distribution of converges to the standard normal distribution for certain values of u and o (a) For what...
Suppose we roll a fair die two times; consider all the combinations of the numbers from...
 Suppose we roll a fair die two times; consider all the combinations of the numbers from each of the two rolls. (a) How many different samples are there? No of samples 36 (b) Consider each of the possible samples. Compute the mean and the standard deviation of all sample means and the distribution of population. (Round mean values to 1 decimal place and standard deviation values to 3 decimal places.) Consider using Excel as a time saver to show all...
Use the Central Limit Theorem for Sums to find the sample mean and sample standard deviation...
 Use the Central Limit Theorem for Sums to find the sample mean and sample standard deviation Question Suppose weights, in pounds, of dogs in a city have an unknown distribution with mean 26 and standard deviation 3 pounds. A sample of size n = 67 is randomly taken from the population and the sum of the values is computed. Using the Central Limit Theorem for Sums, what is the mean for the sample sum distribution? Provide your answer below: pounds
. 21 - Calculate the sample mean, the standard deviation of the sample mean, and determine...
 . 21 - Calculate the sample mean, the standard deviation of the sample mean, and determine its distribution for varying cases where n is small or large and the population is or is not, normally distributed. Household incomes are right-skewed, because most households earn under $150,000 per year, but a minority earn much, much more. Suppose you wanted to determine what the average household income is in central Illinois. In order to do this, you take a simple random sample...
E) Deseribe the probabuiity histogram (symmetry, shape, center And the mean of this discrete rand...
 c-f
on
this page
We were unable to transcribe this imagee) Deseribe the probabuiity histogram (symmetry, shape, center And the mean of this discrete random variable, Х. (Reminden This is asking you to find the mean or a random variable. .not a sample mean.) Show your 二つ、 e) Find the standard deviation of the random variable, X. (Reminder: This is asking you to find the standard deviation of a random variable...not a sample standard deviation.) Keep EXACT fractions throughout the...
c-f
on
this page
We were unable to transcribe this imagee) Deseribe the probabuiity histogram (symmetry, shape, center And the mean of this discrete random variable, Х. (Reminden This is asking you to find the mean or a random variable. .not a sample mean.) Show your 二つ、 e) Find the standard deviation of the random variable, X. (Reminder: This is asking you to find the standard deviation of a random variable...not a sample standard deviation.) Keep EXACT fractions throughout the...
You are to roll a fair die n=123 times, each time observing the number of dots...
You are to roll a fair die n=123 times, each time observing the number of dots appearing on the topside of the die. The number of dots showing on the topside of toss i is a random variable represented by Xi, i=1,2,⋯,123. (a) Consider the distribution of the random variable Xi. Find the mean and the standard deviation of the number of dots showing on the uppermost face of a single roll of this die. μXi= (at least one decimal)...
(1 point) You are to roll a fair die n = 104 times, each time observing the number of dots appearing on the topside of...
 (1 point) You are to roll a fair die n = 104 times, each time observing the number of dots appearing on the topside of the die. The number of dots showing on the topside of toss i is a random variable represented by Xi, i = 1,2, ..., 104 (a) Consider the distribution of the random variable Xi. Find the mean and the standard deviation of the number of dots showing on the uppermost face of a single roll...
Use the Central Limit Theorem to find the mean and standard error of the mean of...
Use the Central Limit Theorem to find the mean and standard error of the mean of the sampling distribution. Then sketch a graph of the sampling distribution. The mean price of photo printers on a website is $243 with a standard deviation of $59. Random samples of size 26 are drawn from this population and the mean of each sample is determined. The mean of the distribution of sample means is _______.
 1. Roll the die 40 times and record the rolled values in the table below. These represent 40 observations of X. 2. Calculate the sample mean of your 40 rolls using Excel. This number represents a single observation of the random variable X (which, again, is a random variable representing the sample mean of 40 rolls of a die). Record the value for the sample mean in the space below: Sample Mean Observation (= first observation of X): 4. Do...
 R commands
2) Illustrating the central limit theorem. X, X, X, a sequence of independent random variables with the same distribution as X. Define the sample mean X by X = A + A 2 be a random variable having the exponential distribution with A -2. Denote by -..- The central limit theorem applied to this particular case implices that the probability distribution of converges to the standard normal distribution for certain values of u and o (a) For what...
R commands
2) Illustrating the central limit theorem. X, X, X, a sequence of independent random variables with the same distribution as X. Define the sample mean X by X = A + A 2 be a random variable having the exponential distribution with A -2. Denote by -..- The central limit theorem applied to this particular case implices that the probability distribution of converges to the standard normal distribution for certain values of u and o (a) For what...
 Suppose we roll a fair die two times; consider all the combinations of the numbers from each of the two rolls. (a) How many different samples are there? No of samples 36 (b) Consider each of the possible samples. Compute the mean and the standard deviation of all sample means and the distribution of population. (Round mean values to 1 decimal place and standard deviation values to 3 decimal places.) Consider using Excel as a time saver to show all...
 Use the Central Limit Theorem for Sums to find the sample mean and sample standard deviation Question Suppose weights, in pounds, of dogs in a city have an unknown distribution with mean 26 and standard deviation 3 pounds. A sample of size n = 67 is randomly taken from the population and the sum of the values is computed. Using the Central Limit Theorem for Sums, what is the mean for the sample sum distribution? Provide your answer below: pounds
 . 21 - Calculate the sample mean, the standard deviation of the sample mean, and determine its distribution for varying cases where n is small or large and the population is or is not, normally distributed. Household incomes are right-skewed, because most households earn under $150,000 per year, but a minority earn much, much more. Suppose you wanted to determine what the average household income is in central Illinois. In order to do this, you take a simple random sample...
 c-f
on
this page
We were unable to transcribe this imagee) Deseribe the probabuiity histogram (symmetry, shape, center And the mean of this discrete random variable, Х. (Reminden This is asking you to find the mean or a random variable. .not a sample mean.) Show your 二つ、 e) Find the standard deviation of the random variable, X. (Reminder: This is asking you to find the standard deviation of a random variable...not a sample standard deviation.) Keep EXACT fractions throughout the...
c-f
on
this page
We were unable to transcribe this imagee) Deseribe the probabuiity histogram (symmetry, shape, center And the mean of this discrete random variable, Х. (Reminden This is asking you to find the mean or a random variable. .not a sample mean.) Show your 二つ、 e) Find the standard deviation of the random variable, X. (Reminder: This is asking you to find the standard deviation of a random variable...not a sample standard deviation.) Keep EXACT fractions throughout the...
 (1 point) You are to roll a fair die n = 104 times, each time observing the number of dots appearing on the topside of the die. The number of dots showing on the topside of toss i is a random variable represented by Xi, i = 1,2, ..., 104 (a) Consider the distribution of the random variable Xi. Find the mean and the standard deviation of the number of dots showing on the uppermost face of a single roll...
Most questions answered within 3 hours.
-
26) Briefly describe, using words or simple diagrams, the
chemiosmotic theory for coupling oxidation to phosphorylation...
asked 42 minutes ago -
Suppose that XX is a random variable with mean 16 and standard
deviation 5 . Also...
asked 1 hour ago -
Calculate the number density of argon gas at a temperature of
24C and a pressure of...
asked 4 hours ago -
Alternative
Classification
How to Estimate
Probabilities from Data? ( For continuous Attributes)
And How to generate...
asked 4 hours ago -
An explosion breaks a 20.0-kg object into three parts. The
object is initially moving at a...
asked 5 hours ago -
Calculate the approximate number of residues of Rubisco, which
is involved in carbon fixation in plants,...
asked 6 hours ago -
Other decisions about scientific claims can have a much broader
impact.ENERGYarrow-10x10.png, environment, health, security - all...
asked 7 hours ago -
I need to write a research paper and work cited about this
topic: The United States...
asked 7 hours ago -
Hello! I was wondering if I could have some help?
If the vapor pressure of carvone...
asked 8 hours ago -
An economist wants to estimate the mean per capita income (in
thousands of dollars) for a...
asked 8 hours ago -
What would be the input/output characteristic of a circuit
obtained by putting two of your 2's-complementers...
asked 8 hours ago -
In Drosophila, the transition from the syncytial blastoderm
stage to the cellular blastoderm stage is a...
asked 9 hours ago