
Homework Answers

Add Answer to:
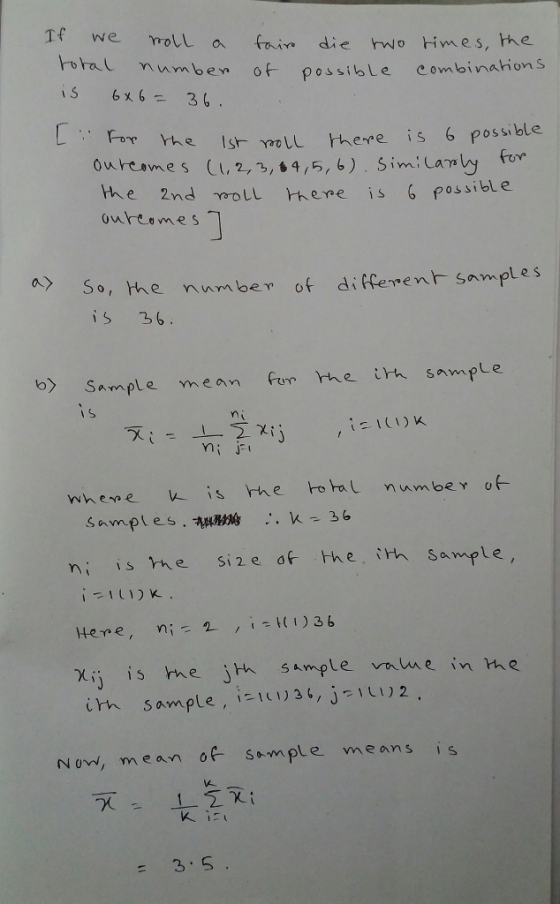
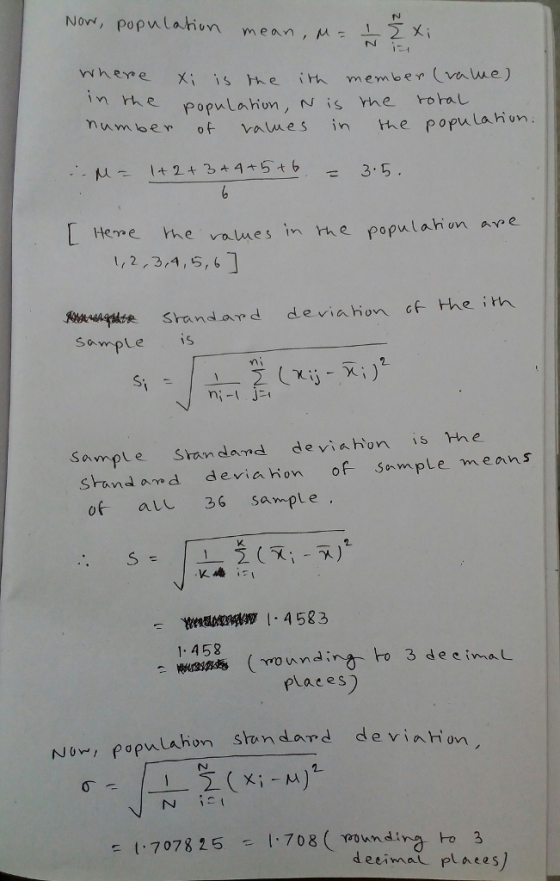
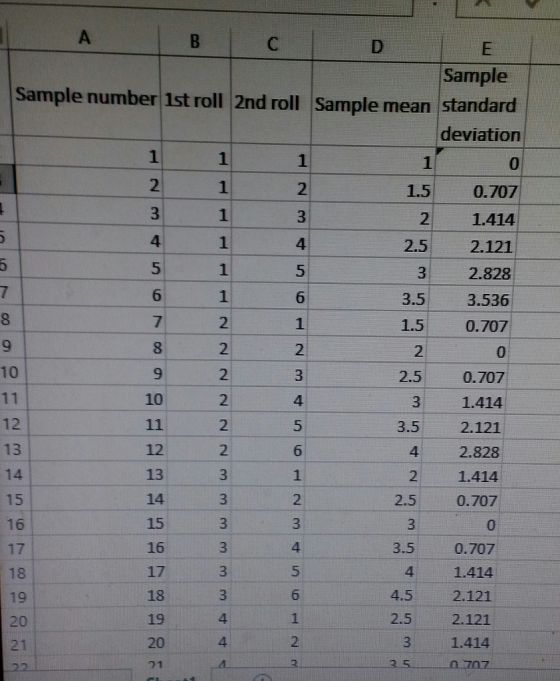
Suppose we roll a fair die two times; consider all the combinations of the numbers from...
1. Roll the die 40 times and record the rolled values in the table below. These...
 1. Roll the die 40 times and record the rolled values in the table below. These represent 40 observations of X. 2. Calculate the sample mean of your 40 rolls using Excel. This number represents a single observation of the random variable X (which, again, is a random variable representing the sample mean of 40 rolls of a die). Record the value for the sample mean in the space below: Sample Mean Observation (= first observation of X): 4. Do...
5. Roll the die another 40 times and calculate the value of x. Sample Mean Observation...
 5. Roll the die another 40 times and calculate the value of x. Sample Mean Observation (= second observation of X): 6. Now write your two X values (one from question 2 and one from question 5). Comment on the values. 7. The random variable X represents the outcome of a single roll of the die, and the random variable X represents the sample mean of 40 rolls of the die. Use the Central Limit Theorem, and the values in...
The random variable X represents the roll of a 10-sided fair die
The random variable X represents the roll of a 10-sided fair die. That is to say its sample space is the set {1,2,3,4,5,6,7,8,9,10}, with each outcome equally likely. Calculate the following population parameters: a.) The population mean: μx = _______ b.) The population variance and standard deviation: c.) The expected value E[X²] 9.) For the normal random variable X with mean μ = 50 and standard deviation σ = 4, a.) Find the probability P(x > 60) = b.) Find the probability (49 < x̄ <...
You roll a fair 6-sided die 1000 times and determine your “score” by summing over all...
You roll a fair 6-sided die 1000 times and determine your “score” by summing over all your rolls. What are the average, variance and standard deviation of your score for this game? What is the probability that you scored less than 3300? That you scored more than 3600?
You are to roll a fair die n=123 times, each time observing the number of dots...
You are to roll a fair die n=123 times, each time observing the number of dots appearing on the topside of the die. The number of dots showing on the topside of toss i is a random variable represented by Xi, i=1,2,⋯,123. (a) Consider the distribution of the random variable Xi. Find the mean and the standard deviation of the number of dots showing on the uppermost face of a single roll of this die. μXi= (at least one decimal)...
(1 point) You are to roll a fair die n = 104 times, each time observing the number of dots appearing on the topside of...
 (1 point) You are to roll a fair die n = 104 times, each time observing the number of dots appearing on the topside of the die. The number of dots showing on the topside of toss i is a random variable represented by Xi, i = 1,2, ..., 104 (a) Consider the distribution of the random variable Xi. Find the mean and the standard deviation of the number of dots showing on the uppermost face of a single roll...
Probability and Random Processes for Engineers You roll a fair die twice: all 36 outcomes are...
 Probability and Random Processes for
Engineers
You roll a fair die twice: all 36 outcomes are equally likely. Let A be the event that the first roll is 1, 2, or 3. Let B be the event that the second roll is 6. Finally, let C be the event that the sum of the rolls is even. (a) Show that any two of A, B, and C are independent (b) Are A, B, and C independent? Derive your answer two...
Probability and Random Processes for
Engineers
You roll a fair die twice: all 36 outcomes are equally likely. Let A be the event that the first roll is 1, 2, or 3. Let B be the event that the second roll is 6. Finally, let C be the event that the sum of the rolls is even. (a) Show that any two of A, B, and C are independent (b) Are A, B, and C independent? Derive your answer two...
Question 3 3 pts Matching problem [Choose] You roll a fair six-sided die 500 times and...
 Question 3 3 pts Matching problem [Choose] You roll a fair six-sided die 500 times and observe a 3 on 90 of the 500 rolls. You estimate the probability of rolling a 3 to be 0.18 Choose) You roll a fair six-sided die 10 times and observe a 3 on all 10 rolls. You bet the probability of rolling a 3 on the next rollis close to O since you have already had 10 3's in a row You assign...
Heed help with c only. (1 point) You are to roll a fair die n =...
 Heed help with c only.
(1 point) You are to roll a fair die n = 108 times, each time observing if the topside of the die shows a 6 (success) or not (failure). After observing the n = 108 tosses, you are to count the number of times the topside showed a 6. This count is represented by the random variable X. A. with a mean 18 and a standard deviation 3.87 !! . (a) The distribution of X...
Heed help with c only.
(1 point) You are to roll a fair die n = 108 times, each time observing if the topside of the die shows a 6 (success) or not (failure). After observing the n = 108 tosses, you are to count the number of times the topside showed a 6. This count is represented by the random variable X. A. with a mean 18 and a standard deviation 3.87 !! . (a) The distribution of X...
A die is rolled 120 times to see if it is fair. The table below shows...
 A die is rolled 120 times to see if it is fair. The table below shows the frequencies for each of the six possible outcomes. Use a level of significance of a=0.10. a. Complete the rest of the table by filling in the expected frequencies (enter your answers in fraction form) Frequency of Dice Values Outcome Frequency Expected Frequency aw- b. What is the correct statistical test to use? Select an answer c. What are the null and alternative hypotheses?...
 1. Roll the die 40 times and record the rolled values in the table below. These represent 40 observations of X. 2. Calculate the sample mean of your 40 rolls using Excel. This number represents a single observation of the random variable X (which, again, is a random variable representing the sample mean of 40 rolls of a die). Record the value for the sample mean in the space below: Sample Mean Observation (= first observation of X): 4. Do...
 5. Roll the die another 40 times and calculate the value of x. Sample Mean Observation (= second observation of X): 6. Now write your two X values (one from question 2 and one from question 5). Comment on the values. 7. The random variable X represents the outcome of a single roll of the die, and the random variable X represents the sample mean of 40 rolls of the die. Use the Central Limit Theorem, and the values in...
 (1 point) You are to roll a fair die n = 104 times, each time observing the number of dots appearing on the topside of the die. The number of dots showing on the topside of toss i is a random variable represented by Xi, i = 1,2, ..., 104 (a) Consider the distribution of the random variable Xi. Find the mean and the standard deviation of the number of dots showing on the uppermost face of a single roll...
 Probability and Random Processes for
Engineers
You roll a fair die twice: all 36 outcomes are equally likely. Let A be the event that the first roll is 1, 2, or 3. Let B be the event that the second roll is 6. Finally, let C be the event that the sum of the rolls is even. (a) Show that any two of A, B, and C are independent (b) Are A, B, and C independent? Derive your answer two...
Probability and Random Processes for
Engineers
You roll a fair die twice: all 36 outcomes are equally likely. Let A be the event that the first roll is 1, 2, or 3. Let B be the event that the second roll is 6. Finally, let C be the event that the sum of the rolls is even. (a) Show that any two of A, B, and C are independent (b) Are A, B, and C independent? Derive your answer two...
 Question 3 3 pts Matching problem [Choose] You roll a fair six-sided die 500 times and observe a 3 on 90 of the 500 rolls. You estimate the probability of rolling a 3 to be 0.18 Choose) You roll a fair six-sided die 10 times and observe a 3 on all 10 rolls. You bet the probability of rolling a 3 on the next rollis close to O since you have already had 10 3's in a row You assign...
 Heed help with c only.
(1 point) You are to roll a fair die n = 108 times, each time observing if the topside of the die shows a 6 (success) or not (failure). After observing the n = 108 tosses, you are to count the number of times the topside showed a 6. This count is represented by the random variable X. A. with a mean 18 and a standard deviation 3.87 !! . (a) The distribution of X...
Heed help with c only.
(1 point) You are to roll a fair die n = 108 times, each time observing if the topside of the die shows a 6 (success) or not (failure). After observing the n = 108 tosses, you are to count the number of times the topside showed a 6. This count is represented by the random variable X. A. with a mean 18 and a standard deviation 3.87 !! . (a) The distribution of X...
 A die is rolled 120 times to see if it is fair. The table below shows the frequencies for each of the six possible outcomes. Use a level of significance of a=0.10. a. Complete the rest of the table by filling in the expected frequencies (enter your answers in fraction form) Frequency of Dice Values Outcome Frequency Expected Frequency aw- b. What is the correct statistical test to use? Select an answer c. What are the null and alternative hypotheses?...
Most questions answered within 3 hours.
-
A fast food meal has 5660 kJ of energy. A person uses energy at
a rate...
asked 6 minutes ago -
The pKb for a generic amine(R-NH2)) in
aqueous solution is 6.30. What is its pKa?
asked 7 minutes ago -
The following reactions have the indicated equilibrium constants
at a particular temperature: N2(g) + O2(g) ⇌...
asked 9 minutes ago -
Please Help ASAP.
1Consider the below code which iterates over a linked
list of n nodes...
asked 25 minutes ago -
Determine the air to fuel ratio of:
Canadian natural gas, with 93.9% methane, 4.2% ethane, 0.3%...
asked 26 minutes ago -
A manufacturer of power tools claims that the average amount of
time required to assemble their...
asked 28 minutes ago -
"electron-withdrawing substituents on carbon encourage back
donation", then on the next page he says that "greater...
asked 39 minutes ago -
On December 31, 2016, the shareholders’ equity section of the
balance sheet of R & L...
asked 48 minutes ago -
16.7
At t=0s a small "upward" (positive y) pulse centered at x = 5.0
m is...
asked 1 hour ago -
Twitter Users and News: A poll conducted in 2013 found that 52%
of U.S. adult Twitter...
asked 1 hour ago -
How
would I know whether a given amino acid has an ionizable group or
not? please...
asked 1 hour ago -
True or false?
True False The function of the enzyme acyl CoA
synthetase is the ATP-dependent coupling...
asked 1 hour ago