


Homework Answers
1.
a)
Option B is correct.
a t-test for two paired samples be used
b)
The following table is obtained:
|
Sample 1 |
Sample 2 |
Difference = Sample 1 - Sample 2 |
|
|
40 |
37 |
3 |
|
|
30 |
33 |
-3 |
|
|
53 |
50 |
3 |
|
|
47 |
46 |
1 |
|
|
40 |
35 |
5 |
|
|
Average |
42 |
40.2 |
1.8 |
|
St. Dev. |
8.631 |
7.396 |
3.033 |
|
n |
5 |
5 |
5 |
From the sample data, it is found that the corresponding sample means are:
Xˉ1=42
Xˉ2=40.2
Also, the provided sample standard deviations are:
s_1 = 8.631
s2=7.396
and the sample size is n = 5.
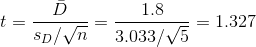
For the score differences we have
Dˉ=1.8
sD=3.033
() Null and Alternative Hypotheses
The following null and alternative hypotheses need to be tested:
Ho: μD = 0
Ha: μD > 0
This corresponds to a right-tailed test, for which a t-test for two paired samples be used.
() Test Statistics
The t-statistic is computed as shown in the following formula:
() Decision about the null hypothesis
Using the P-value approach: The p-value is p = 0.1276,
and since p = 0.1276≥0.10,
it is concluded that the null hypothesis is not rejected.
() Conclusion
It is concluded that the null hypothesis Ho is not rejected.
Therefore, there is not enough evidence to claim that the population mean μ1 is greater than μ2, at the 0.10 significance level.
2.
1)
Option B is correct.
2)
Option d is correct.
3.
The provided sample mean is Xˉ=3439
and
the sample standard deviation is s = 2567.
The size of the sample is n = 100
and the required confidence level is 90%.
The number of degrees of freedom are df = 100 - 1 = 99,
and the significance level is α=0.1.
Based on the provided information,
the critical t-value for α=0.1 and df = 99 degrees of freedom is
t_c = 1.66
The 90% confidence for the population mean μ is computed using the following expression

Therefore, based on the information provided, the 90 % confidence for the population mean μ is


option c is correct
Please like
Add Answer to:
U 4 5 The data table represents the measure of a variable before and after a...
15. The data table represents the measure of a variable before and after a treatment. Does...
 15. The data table represents the measure of a variable before and after a treatment. Does the sample evidence suggest that the treatment is effective in decreasing the value of the response variable? Use the a= 0.05 level of significance. Complete parts (a) through (d). Individual Before, After, y 1 40 4 2 30 3 52 5 36 50 38 33 48 47 31 (a) What type of test should be used? Choose the correct answer below. O A. A...
3. Determine whether the following sampling is dependent or independent. Indicate whether the response variable is...
 3. Determine whether the following sampling is dependent or independent. Indicate whether the response variable is qualitative or quantitative. A researcher wishes to compare personality types of married pharmacists and their spouses. She obtains a random sample of 187 such couples who take a personality inventory and determines each spouse's personality type. Determine whether the following sampling is dependent or independent. O A. The sampling is dependent because an individual selected for one sample does not dictate which individual is...
If you perform a hypothesis test on the population slope Parameter (β1) in regression analysis and...
If you perform a hypothesis test on the population slope Parameter (β1) in regression analysis and reject the Null hypothesis: Ho: β1= 0. Your conclusion would be: A.) The least squares sample regression equation should not be used because there is not sufficient evidence of a relationship between the independent variable and the dependent variable.. B.) The least squares sample regression equation should be used because there is sufficient evidence of a relationship between the independent variable and the dependent...
Use the following information to complete steps (a) through (d) below. A random sample of size...
 Use the following information to complete steps (a) through (d) below. A random sample of size n = 31 results in a sample mean of 123.3 and a sample standard deviation of 8.5. An independent sample of size n2 = 50 results in a sample mean of 129.8 and sample standard deviation of 7.3. Does this constitute sufficient evidence to conclude that the population means differ at the x = 0.005 level of significance? (a) What type of test should...
The table to the right contairs observed values and expected values in parentheses for two categorical...
 The table to the right contairs observed values and expected values in parentheses for two categorical variables, X and Y where variable: X has the categories and variable: Y hasta categories. Use the table to complete aarts(a) and (b) helow. 23.05 (42313 45.643 16 1916 114.15 (17.6939.16 2 (a) Compute the value of the chi-square test statistic. Round to three decimal places needed. (b) Test the hypothesis that X and Y are Independent at the a=0.1 level of algnilcance. O...
14. Use the following information to complete steps (a) through (d) below. A random sample of...
 14. Use the following information to complete steps (a) through (d) below. A random sample of n = 135 individuals results in x1 = 40 successes. An independent sample of n2 = 140 individuals results in X2 = 60 successes. Does this represent sufficient evidence to conclude that p1 <P2 at the a=0.05 level of significance? (a) What type of test should be used? O A. A hypothesis test regarding the difference between two population proportions from independent samples. OB....
01) 04) Answer option: Since the P-Value is (greater. Less) than the significance level (fail to reject. Reject) the n...
 01)
04)
Answer option:
Since the P-Value is (greater. Less) than the
significance level (fail to reject. Reject) the
null hypothesis. There (is not. Is) sufficient
evidence to support the claim of a difference in measurements
between the two arms.
Determine whether the samples are independent or dependent. A data set included the daily number of words spoken by 60 randomly selected women and 60 randomly selected men. Choose the correct answer below. O A. The samples are dependent because...
01)
04)
Answer option:
Since the P-Value is (greater. Less) than the
significance level (fail to reject. Reject) the
null hypothesis. There (is not. Is) sufficient
evidence to support the claim of a difference in measurements
between the two arms.
Determine whether the samples are independent or dependent. A data set included the daily number of words spoken by 60 randomly selected women and 60 randomly selected men. Choose the correct answer below. O A. The samples are dependent because...
A random sample of size n= 15 obtained from a population that is normally distributed results...
 A random sample of size n= 15 obtained from a population that is normally distributed results in a sample mean of 45.8 and sample standard deviation 12.2. An independent sample of size n = 20 obtained from a population that is normally distributed results in a sample mean of 51.9 and sample standard deviation 14.6. Does this constitute sufficient evidence to conclude that the population means differ at the a = 0.05 level of significance? Click here to view the...
16. A student wants to determine if there is a difference in the pricing between two...
 16. A student wants to determine if there is a difference in the pricing between two stores for health and beauty supplies. She recorded prices from both stores for each of 10 different products. Assuming that the conditions for conducting the test are satisfied, determine if there is a price difference between the two stores. Use the a=0.005 level of significance Complete parts (a) through (d) below. A B с D E F G H 5.99 7.41 3.77 1.78 1.72...
Assume that the differences are normally distributed. Complete parts (a) through (d) below. 1 4 5...
 Assume that the differences are normally distributed. Complete parts (a) through (d) below. 1 4 5 Observation X 2 47.2 3 43.6 6 45.6 7 48.2 8 49.6 42.3 46.4 47.9 Y 45.5 46.4 45.7 50.5 50.4 45.7 49.4 49.7 (a) Determine d; = X; - Yfor each pair of data. 1 2 3 4 5 6 7 8 Observation d (Type integers or decimals.) (b) Computed and sa d= (Round to three decimal places as needed.) Sd = (Round...
 15. The data table represents the measure of a variable before and after a treatment. Does the sample evidence suggest that the treatment is effective in decreasing the value of the response variable? Use the a= 0.05 level of significance. Complete parts (a) through (d). Individual Before, After, y 1 40 4 2 30 3 52 5 36 50 38 33 48 47 31 (a) What type of test should be used? Choose the correct answer below. O A. A...
 3. Determine whether the following sampling is dependent or independent. Indicate whether the response variable is qualitative or quantitative. A researcher wishes to compare personality types of married pharmacists and their spouses. She obtains a random sample of 187 such couples who take a personality inventory and determines each spouse's personality type. Determine whether the following sampling is dependent or independent. O A. The sampling is dependent because an individual selected for one sample does not dictate which individual is...
 Use the following information to complete steps (a) through (d) below. A random sample of size n = 31 results in a sample mean of 123.3 and a sample standard deviation of 8.5. An independent sample of size n2 = 50 results in a sample mean of 129.8 and sample standard deviation of 7.3. Does this constitute sufficient evidence to conclude that the population means differ at the x = 0.005 level of significance? (a) What type of test should...
 The table to the right contairs observed values and expected values in parentheses for two categorical variables, X and Y where variable: X has the categories and variable: Y hasta categories. Use the table to complete aarts(a) and (b) helow. 23.05 (42313 45.643 16 1916 114.15 (17.6939.16 2 (a) Compute the value of the chi-square test statistic. Round to three decimal places needed. (b) Test the hypothesis that X and Y are Independent at the a=0.1 level of algnilcance. O...
 14. Use the following information to complete steps (a) through (d) below. A random sample of n = 135 individuals results in x1 = 40 successes. An independent sample of n2 = 140 individuals results in X2 = 60 successes. Does this represent sufficient evidence to conclude that p1 <P2 at the a=0.05 level of significance? (a) What type of test should be used? O A. A hypothesis test regarding the difference between two population proportions from independent samples. OB....
 01)
04)
Answer option:
Since the P-Value is (greater. Less) than the
significance level (fail to reject. Reject) the
null hypothesis. There (is not. Is) sufficient
evidence to support the claim of a difference in measurements
between the two arms.
Determine whether the samples are independent or dependent. A data set included the daily number of words spoken by 60 randomly selected women and 60 randomly selected men. Choose the correct answer below. O A. The samples are dependent because...
01)
04)
Answer option:
Since the P-Value is (greater. Less) than the
significance level (fail to reject. Reject) the
null hypothesis. There (is not. Is) sufficient
evidence to support the claim of a difference in measurements
between the two arms.
Determine whether the samples are independent or dependent. A data set included the daily number of words spoken by 60 randomly selected women and 60 randomly selected men. Choose the correct answer below. O A. The samples are dependent because...
 A random sample of size n= 15 obtained from a population that is normally distributed results in a sample mean of 45.8 and sample standard deviation 12.2. An independent sample of size n = 20 obtained from a population that is normally distributed results in a sample mean of 51.9 and sample standard deviation 14.6. Does this constitute sufficient evidence to conclude that the population means differ at the a = 0.05 level of significance? Click here to view the...
 16. A student wants to determine if there is a difference in the pricing between two stores for health and beauty supplies. She recorded prices from both stores for each of 10 different products. Assuming that the conditions for conducting the test are satisfied, determine if there is a price difference between the two stores. Use the a=0.005 level of significance Complete parts (a) through (d) below. A B с D E F G H 5.99 7.41 3.77 1.78 1.72...
 Assume that the differences are normally distributed. Complete parts (a) through (d) below. 1 4 5 Observation X 2 47.2 3 43.6 6 45.6 7 48.2 8 49.6 42.3 46.4 47.9 Y 45.5 46.4 45.7 50.5 50.4 45.7 49.4 49.7 (a) Determine d; = X; - Yfor each pair of data. 1 2 3 4 5 6 7 8 Observation d (Type integers or decimals.) (b) Computed and sa d= (Round to three decimal places as needed.) Sd = (Round...
Most questions answered within 3 hours.
-
Given input { 66, 28, 43, 29, 44, 69, 19 } and a hash function
h(x)...
asked 16 minutes ago -
A pebble with mass m is thrown straight up with an initial speed
v0 so that...
asked 20 minutes ago -
Let X be a discrete random variable that follows a
binomial distribution with n = 11...
asked 28 minutes ago -
The equilibrium constant, K, for the following reaction is
1.29×10⁻² at 600
K.
COCl2(g) --->
CO(g)...
asked 41 minutes ago -
It is known that 72% of people have a favorable opinion of their
local police force....
asked 44 minutes ago -
A vertical straight wire carrying an upward 26-A current exerts
an attractive force per unit length...
asked 57 minutes ago -
For the purposes of this assignment, you are to choose an
adaptive trait common to more...
asked 1 hour ago -
Two identical flutes can play middle C (262 Hz) at 20◦C. How
many beats per second...
asked 1 hour ago -
Potassium phosphate and calcium chloride react in a double
replacement reaction. To produce 1.0 moles of...
asked 1 hour ago -
Sparky, Co. purchased land as a factory site for $600,000.
Sparky paid $42,000 to tear down...
asked 1 hour ago -
A Chi-square distribution with 14 degrees of freedom is a
correct model for
Question 8 options:...
asked 1 hour ago -
In a group of 45 mice, there are 10 that have a certain genetic
character. suppose...
asked 1 hour ago