

Homework Answers


![HR Console > Critical.Value=gt (0.99,1407) > Critical Value [1] 2.329001 > Teegt (0.995, 1407) > Te [1] 2.579328 >|](http://img.homeworklib.com/questions/0a43ed20-0fb8-11eb-8d5b-0b762249ff75.png?x-oss-process=image/resize,w_560)
Add Answer to:
A researcher with the Department of Education followed a cohort of students who graduated from high...
Albicher with the Department of Education followed a cohort of students who graduated from high school...
 Albicher with the Department of Education followed a cohort of students who graduated from high school in a certain year, monitoring the progress the students made toward completing a bachelor's degree. One aspect of his research was to determine whether students who first attended community college took longer to attain a bachelor's degree than those who immediately attended and remained at a 4-year institution. The data in the table attached below summarize the results of his study Complete parts a)...
In a study that followed a group of students who graduated from high school in 1997,...
In a study that followed a group of students who graduated from high school in 1997, each was monitored in progress made toward earning a bachelor’s degree. The group was divided into two – those who started at community college and later transferred to a four-year college (group 1), and those that started out in a four-year college as freshmen (group 2). The data below summarize the findings: Community College Transfers Non-Transfers n 317 1,297 Mean Time to Graduate 5.12...
(a) Determine the test statistic (t = ?). Round to two decimal places as needed. (b)...
 (a) Determine the test statistic (t =
?). Round to two decimal places as needed.
(b) Construct a 90% confidence interval for
μcommunity college − μno transfer to
approximate the mean additional time it takes to complete a
bachelor's degree if you begin in community college. The bounds of
a (1 − α) • 100% confidence interval about μ1 −
μ2 can be found using the following formulas, where
tα/2 is the critical value. Round to six decimal places
as...
(a) Determine the test statistic (t =
?). Round to two decimal places as needed.
(b) Construct a 90% confidence interval for
μcommunity college − μno transfer to
approximate the mean additional time it takes to complete a
bachelor's degree if you begin in community college. The bounds of
a (1 − α) • 100% confidence interval about μ1 −
μ2 can be found using the following formulas, where
tα/2 is the critical value. Round to six decimal places
as...
Two researchers conducted a study in which two groups of students were asked to answer 42...
 Two researchers conducted a study in which two groups of students were asked to answer 42 trivia questions from a board game. The students in group 1 were asked to spend 5 minutes thinking about what it would mean to be a professor, while the students in group 2 were asked to think about soccer hooligans. These pretest thoughts are a form of priming. The 200 students in group 1 had a mean score of 26.2 with a standard deviation...
t-Distribution Area in Right Tail .
 t-Distribution Area in Right Tail
Degrees of Freedom 0.25 0.2
0.15 0.10 0.05
0.025 0.02 0.01
0.005 0.0025 0.001 0.0005
1 1.000 1.376 1.963
3.078 6.314 12.706
15.894 31.821 63.657
127.321 318.309 636.619
2 0.816 1.061 1.386
1.886 2.920 4.303
4.849 6.965 9.925
14.089 22.327 31.599
3 0.765 0.978 1.250
1.638 2.353 3.182
3.482 4.541 5.841
7.453 10.215 12.924
4 0.741 0.941 ...
t-Distribution Area in Right Tail
Degrees of Freedom 0.25 0.2
0.15 0.10 0.05
0.025 0.02 0.01
0.005 0.0025 0.001 0.0005
1 1.000 1.376 1.963
3.078 6.314 12.706
15.894 31.821 63.657
127.321 318.309 636.619
2 0.816 1.061 1.386
1.886 2.920 4.303
4.849 6.965 9.925
14.089 22.327 31.599
3 0.765 0.978 1.250
1.638 2.353 3.182
3.482 4.541 5.841
7.453 10.215 12.924
4 0.741 0.941 ...
0 The following data represent the level Education of health and the level of education for...
 0 The following data represent the level Education of health and the level of education for Not a H.S. graduate a random sample of 1687 residents H.S. graduate Complete parts (a) and (b) below. Some college Bachelor Degree or higher Excellent 74 92 63 75 Good 134 121 148 137 Fair 109 95 80 105 Poor 118 93 126 117 (a) Does the sample evidence suggest that level of education and health are independent at the a=0.05 level of significance?...
An education researcher claims that 54% of college students work year-round. In a random sample of...
 An education researcher claims that 54% of college students work year-round. In a random sample of 200 college students, 108 say they work year-round. At a = 0.01, is there enough evidence to reject the researcher's claim? Complete parts (a) through (e) below. (a) Identify the claim and state Ho and Ha Identify the claim in this scenario. Select the correct choice below and fill in the answer box to complete your choice. (Type an integer or a decimal. Do...
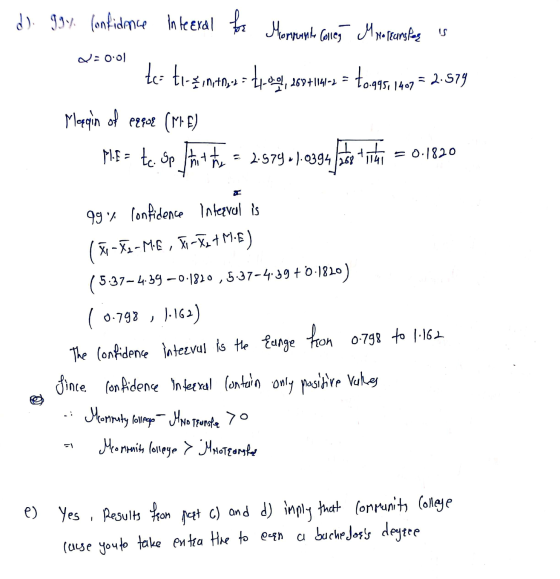
(a) Does the evidence suggest that community college transfer students take longer to attain a bachelor's...
 (a) Does the evidence suggest that community
college transfer students take longer to attain a bachelor's
degree? Use an α = 0.05 level of significance. Perform a hypothesis
test. Determine the null and alternative hypotheses.
(b) Determine the test statistic (t =
?) and the P-value (P = ?). Round to two decimal
places as needed.
(c) Construct a 90% confidence interval for
(μcommunity college − μno transfer) to
approximate the mean additional time it takes to complete a
bachelor's...
(a) Does the evidence suggest that community
college transfer students take longer to attain a bachelor's
degree? Use an α = 0.05 level of significance. Perform a hypothesis
test. Determine the null and alternative hypotheses.
(b) Determine the test statistic (t =
?) and the P-value (P = ?). Round to two decimal
places as needed.
(c) Construct a 90% confidence interval for
(μcommunity college − μno transfer) to
approximate the mean additional time it takes to complete a
bachelor's...
An education researcher claims that at most 8% of working college students are employed as teachers...
 An education researcher claims that at most 8% of working college students are employed as teachers or teaching assistants. In a random sample of 200 working college students, 10% are employed as teachers or teaching assistants. At a = 0.01, is there enough evidence to reject the researcher's claim? Complete parts (a) through (e) below. (a) Identify the claim and state Ho and Ha Identify the claim in this scenario. Select the correct choice below and fill in the answer...
An education researcher daims that at most 7% of working college students are employed as teachers...
 An education researcher daims that at most 7% of working college students are employed as teachers or teaching assistants. In a random sample of 300 working college students, 9% are employed as teachers or teaching assistants. At a 0.01, is there enough evidence to reject the researcher's claim? Complete parts (a) through (e) below. (a) Identify the claim and state Ho and H, Identify the claim in this scenario. Select the correct choice below and fill in the answer box...
 Albicher with the Department of Education followed a cohort of students who graduated from high school in a certain year, monitoring the progress the students made toward completing a bachelor's degree. One aspect of his research was to determine whether students who first attended community college took longer to attain a bachelor's degree than those who immediately attended and remained at a 4-year institution. The data in the table attached below summarize the results of his study Complete parts a)...
 (a) Determine the test statistic (t =
?). Round to two decimal places as needed.
(b) Construct a 90% confidence interval for
μcommunity college − μno transfer to
approximate the mean additional time it takes to complete a
bachelor's degree if you begin in community college. The bounds of
a (1 − α) • 100% confidence interval about μ1 −
μ2 can be found using the following formulas, where
tα/2 is the critical value. Round to six decimal places
as...
(a) Determine the test statistic (t =
?). Round to two decimal places as needed.
(b) Construct a 90% confidence interval for
μcommunity college − μno transfer to
approximate the mean additional time it takes to complete a
bachelor's degree if you begin in community college. The bounds of
a (1 − α) • 100% confidence interval about μ1 −
μ2 can be found using the following formulas, where
tα/2 is the critical value. Round to six decimal places
as...
 Two researchers conducted a study in which two groups of students were asked to answer 42 trivia questions from a board game. The students in group 1 were asked to spend 5 minutes thinking about what it would mean to be a professor, while the students in group 2 were asked to think about soccer hooligans. These pretest thoughts are a form of priming. The 200 students in group 1 had a mean score of 26.2 with a standard deviation...
 t-Distribution Area in Right Tail
Degrees of Freedom 0.25 0.2
0.15 0.10 0.05
0.025 0.02 0.01
0.005 0.0025 0.001 0.0005
1 1.000 1.376 1.963
3.078 6.314 12.706
15.894 31.821 63.657
127.321 318.309 636.619
2 0.816 1.061 1.386
1.886 2.920 4.303
4.849 6.965 9.925
14.089 22.327 31.599
3 0.765 0.978 1.250
1.638 2.353 3.182
3.482 4.541 5.841
7.453 10.215 12.924
4 0.741 0.941 ...
t-Distribution Area in Right Tail
Degrees of Freedom 0.25 0.2
0.15 0.10 0.05
0.025 0.02 0.01
0.005 0.0025 0.001 0.0005
1 1.000 1.376 1.963
3.078 6.314 12.706
15.894 31.821 63.657
127.321 318.309 636.619
2 0.816 1.061 1.386
1.886 2.920 4.303
4.849 6.965 9.925
14.089 22.327 31.599
3 0.765 0.978 1.250
1.638 2.353 3.182
3.482 4.541 5.841
7.453 10.215 12.924
4 0.741 0.941 ...
 0 The following data represent the level Education of health and the level of education for Not a H.S. graduate a random sample of 1687 residents H.S. graduate Complete parts (a) and (b) below. Some college Bachelor Degree or higher Excellent 74 92 63 75 Good 134 121 148 137 Fair 109 95 80 105 Poor 118 93 126 117 (a) Does the sample evidence suggest that level of education and health are independent at the a=0.05 level of significance?...
 An education researcher claims that 54% of college students work year-round. In a random sample of 200 college students, 108 say they work year-round. At a = 0.01, is there enough evidence to reject the researcher's claim? Complete parts (a) through (e) below. (a) Identify the claim and state Ho and Ha Identify the claim in this scenario. Select the correct choice below and fill in the answer box to complete your choice. (Type an integer or a decimal. Do...
 (a) Does the evidence suggest that community
college transfer students take longer to attain a bachelor's
degree? Use an α = 0.05 level of significance. Perform a hypothesis
test. Determine the null and alternative hypotheses.
(b) Determine the test statistic (t =
?) and the P-value (P = ?). Round to two decimal
places as needed.
(c) Construct a 90% confidence interval for
(μcommunity college − μno transfer) to
approximate the mean additional time it takes to complete a
bachelor's...
(a) Does the evidence suggest that community
college transfer students take longer to attain a bachelor's
degree? Use an α = 0.05 level of significance. Perform a hypothesis
test. Determine the null and alternative hypotheses.
(b) Determine the test statistic (t =
?) and the P-value (P = ?). Round to two decimal
places as needed.
(c) Construct a 90% confidence interval for
(μcommunity college − μno transfer) to
approximate the mean additional time it takes to complete a
bachelor's...
 An education researcher claims that at most 8% of working college students are employed as teachers or teaching assistants. In a random sample of 200 working college students, 10% are employed as teachers or teaching assistants. At a = 0.01, is there enough evidence to reject the researcher's claim? Complete parts (a) through (e) below. (a) Identify the claim and state Ho and Ha Identify the claim in this scenario. Select the correct choice below and fill in the answer...
 An education researcher daims that at most 7% of working college students are employed as teachers or teaching assistants. In a random sample of 300 working college students, 9% are employed as teachers or teaching assistants. At a 0.01, is there enough evidence to reject the researcher's claim? Complete parts (a) through (e) below. (a) Identify the claim and state Ho and H, Identify the claim in this scenario. Select the correct choice below and fill in the answer box...
Most questions answered within 3 hours.
-
A diamond's index of refraction for red light, 656 nm, is 2.410,
while that for blue...
asked 7 minutes ago -
Compare HPLC, SPE, and GC. Identify the differences, the
advantages, and the weaknesses of each method.
asked 8 minutes ago -
Characteristic x-rays emitted by potassium have a wavelength of
0.374 nm. What is the energy of...
asked 10 minutes ago -
there is a function to create two random numbers between 1 and
25 and a function...
asked 29 minutes ago -
At a certain temperature, the ?pKp for the decomposition of
H2SH2S is 0.832.0.832.
H2S(g)↽−−⇀H2(g)+S(g)H2S(g)↽−−⇀H2(g)+S(g)
Initially, only...
asked 22 minutes ago -
Part 1.C&A Fast Food has four activities in serving a
customer: greet customer, take order, process...
asked 29 minutes ago -
Which attribute allows you to specify a custom "thumbnail" for
multimedia elements?
asked 1 hour ago -
How much 0.1200 M sodium hydroxide solution is need to titrate
14 mL of a 0.100...
asked 43 minutes ago -
An impulse is a change in momentum usually over
a short time. For which of the...
asked 47 minutes ago -
1a)When a 5000-kg roller coaster train full of riders approaches
the loading dock at a speed...
asked 1 hour ago -
The Poseidon Swim Company produces swim trunks. The average
selling price for one of their swim...
asked 1 hour ago -
If the elasticity of supply of a good is ∞, then its
A. supply curve is...
asked 49 minutes ago