
Homework Answers
Conclusion: There is sufficient evidence to conclude that linear correlation between X and Y is significant.
Add Answer to:
for the data below test weather the linear correlation between x and y is significant. use...
Use the given information to complete the test to determine if there is significant linear correlation...
 Use the given information to complete the test to determine if there is significant linear correlation between numbers of hours a student spent preparing for a test and test scores. Use a significance level of 0.05. 1) The test scores of 6 randomly picked students and the numbers of hours they prepared are 1) as follows: Hours 5 10 4 6 10 9 Score 64 86 69 86 59 87 The equation of the regression line is y = 1.06604x...
Determine if there is a significant positive correlation between the sets of data at a 10%...
 Determine if there is a significant positive correlation between the sets of data at a 10% significance level. Timelimit: 2 hou 40 125 52 154 V 53 164 29 48 25 65 64 33 22 57 56 181 38 45 22 43 Critical Value, terit (three decimal accuracy! Test Statistic, ttest (three decimal accuracy Test Conclusion: Reject Ho. There is enough evidence to suggest a significant positive linear correlation between the data sets. Fail to Reject Ho. There is not...
Show all your work as needed for full credit (20 points each). Use the given information...
 Show all your work as needed for full credit (20 points each). Use the given information to complete the test to determine if there is significant linear correlation between numbers of hours a student spent preparing for a test and test scores. Use a significance level of 0.05. 1) 4 1) The test scores of 6 randomly picked students and the numbers of hours they prepared are as follows: Hours 5 10 6 10 9 Score 64 86 69 86...
Given the following null and alternative hypotheses, the test statistic from the sample data is z=1.875z=1.875....
Given the following null and alternative hypotheses, the test statistic from the sample data is z=1.875z=1.875. If the significance level of 0.05 which results in a critical value of 1.645, what is the conclusion as it relates to the null hypothesis? H0:p=0.22 H1:p>0.22 Fail to reject the alternative hypothesis Reject the null hypothesis Fail to reject the null hypothesis Support the null hypothesis
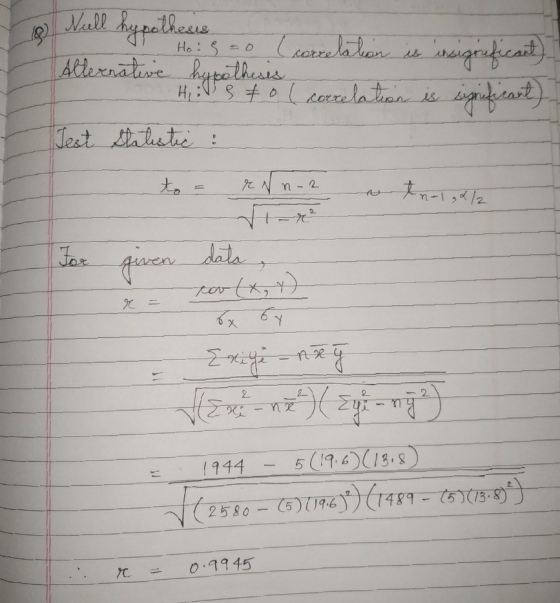
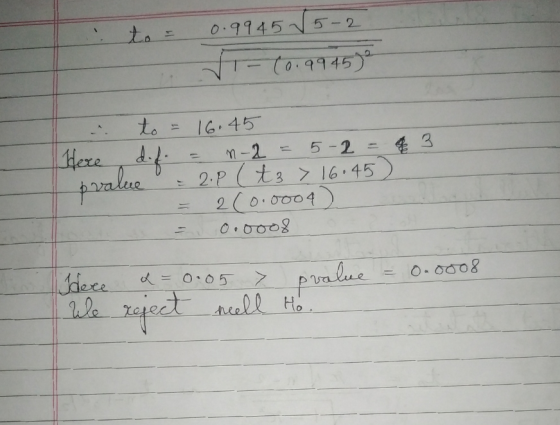
Compute the Pearson Correlation Coefficient, r, for the following data X Y 1 7 3 4...
Compute the Pearson Correlation Coefficient, r, for the following data X Y 1 7 3 4 5 3 4 2 2 4 Note: If it is a decimal number with two or more than two places, leave only two decimal places after the decimal point and do not round. If it is a negative correlation, please do not forget to include the negative sign. 1a) The Pearson Correlation, r is: 1b) The correlation is Group of answer choices a) Medium...
Question 13 20 pts Identify the null hypothesis, alternative hypothesis, test statistic, P-value, conclusion about the...
 Question 13 20 pts Identify the null hypothesis, alternative hypothesis, test statistic, P-value, conclusion about the null hypothesis, and final conclusion that addresses the original claim. Various temperature measurements are recorded at different times during the summer in Holtville on n-60 days. The mean of 8 = 100°F is obtained, with 0 - 10°F. Using the 0.05 significance level, test the claim that the mean temperature is over 995 Hop-100; Hy w 100. Test statistic: 2-0.77. P-value: 0.7794. Because the...
7. You are testing the null hypothesis that there is no linear relationship between two variables,...
7. You are testing the null hypothesis that there is no linear relationship between two variables, X and Y. From your sample of n=18, you determine that b1=4.4 and Sb1=1.7. a. What is the value of tSTAT? b. At the α=0.05 level of significance, what are the critical values? c. Based on your answers to (a) and (b), what statistical decision should you make? d. Construct a 95% confidence interval estimate of the population slope, β1. 8. You are testing...
Question 29 1 pts If a test of hypothesis is conducted at a 0.05 level of...
 Question 29 1 pts If a test of hypothesis is conducted at a 0.05 level of significance and the p-value resulting from the analysis is 0.092. The conclusion is: Reject the null hypothesis Fail to reject the null hypothesis Reject the alternative hypothesis Question 30 1 pts If a test of hypothesis is conducted at a 0.05 level of significance and the p-value resulting from the analysis is 0.092. The potential type of statistical error is: Type Il error Type...
Use the given information to find the p-value. Use a 0.05 significance level and state the...
Use the given information to find the p-value. Use a 0.05 significance level and state the conclusion about the null hypothesis (reject the null hypothesis or fail to reject the null hypothesis). a. The test statistic in a right-tailed test is z = 1.00. b. The test statistic in a test with alternative hypothesis p 6= 5/7 is z = 2.05. c. The test statistic in a test with alternative hypothesis p < 2/3 in z = −0.45.
 Use the given information to complete the test to determine if there is significant linear correlation between numbers of hours a student spent preparing for a test and test scores. Use a significance level of 0.05. 1) The test scores of 6 randomly picked students and the numbers of hours they prepared are 1) as follows: Hours 5 10 4 6 10 9 Score 64 86 69 86 59 87 The equation of the regression line is y = 1.06604x...
 Determine if there is a significant positive correlation between the sets of data at a 10% significance level. Timelimit: 2 hou 40 125 52 154 V 53 164 29 48 25 65 64 33 22 57 56 181 38 45 22 43 Critical Value, terit (three decimal accuracy! Test Statistic, ttest (three decimal accuracy Test Conclusion: Reject Ho. There is enough evidence to suggest a significant positive linear correlation between the data sets. Fail to Reject Ho. There is not...
 Show all your work as needed for full credit (20 points each). Use the given information to complete the test to determine if there is significant linear correlation between numbers of hours a student spent preparing for a test and test scores. Use a significance level of 0.05. 1) 4 1) The test scores of 6 randomly picked students and the numbers of hours they prepared are as follows: Hours 5 10 6 10 9 Score 64 86 69 86...
 Show all your work as needed for full credit (20 points each). Use the given information to complete the test to determine if there is significant linear correlation between numbers of hours a student spent preparing for a test and test scores. Use a significance level of 0.05. 1) 4 1) The test scores of 6 randomly picked students and the numbers of hours they prepared are as follows: Hours 5 10 6 10 9 Score 64 86 69 86...
 Question 13 20 pts Identify the null hypothesis, alternative hypothesis, test statistic, P-value, conclusion about the null hypothesis, and final conclusion that addresses the original claim. Various temperature measurements are recorded at different times during the summer in Holtville on n-60 days. The mean of 8 = 100°F is obtained, with 0 - 10°F. Using the 0.05 significance level, test the claim that the mean temperature is over 995 Hop-100; Hy w 100. Test statistic: 2-0.77. P-value: 0.7794. Because the...
 Question 29 1 pts If a test of hypothesis is conducted at a 0.05 level of significance and the p-value resulting from the analysis is 0.092. The conclusion is: Reject the null hypothesis Fail to reject the null hypothesis Reject the alternative hypothesis Question 30 1 pts If a test of hypothesis is conducted at a 0.05 level of significance and the p-value resulting from the analysis is 0.092. The potential type of statistical error is: Type Il error Type...
Most questions answered within 3 hours.
-
A 2.0 μF parallel-plate air-filled capacitor is connected
across a 10 V battery.
(a) Determine the...
asked 29 seconds from now -
ECO
2013 &
asked 3 minutes ago -
Insight refers to:
a.
Adaptive decision-making
b.
Credibility and trustworthness
c.
Understanding of one's problems
d....
asked 9 minutes ago -
Explain the differences between rights and permissions within
Windows. Define the principle of least privilege and...
asked 17 minutes ago -
A solid, frictionless cylindrical reel of mass M=5.00kg and
radius R=0.55m is used to draw water...
asked 19 minutes ago -
how do radio waves get emitted from Jupiter?
- do they come from radiation from planet...
asked 20 minutes ago -
The test statistic used in the F test for the equality of two
variances is calculated...
asked 31 minutes ago -
How does neutralisation of IL-6 trans-signaling affect the
autoimmune disease and inflammation? What if the trans-signaling...
asked 22 minutes ago -
f an allele is 'fixed' in a population, what is its
frequency?
0.50
0.75
0.25
0...
asked 36 minutes ago -
Do we have a duty of national loyalty in business? What is the
major argument in...
asked 36 minutes ago -
compare the international treatment of segment reporting to the
us gaap treatment
asked 32 minutes ago -
A statistics student finds herself struggling with a newspaper
article stating that only eighteen percent of...
asked 1 hour ago