
Homework Answers
Summary-This problem is solved by using basics of electronics. Below are the details of solution uploaded in sequence.

Add Answer to:
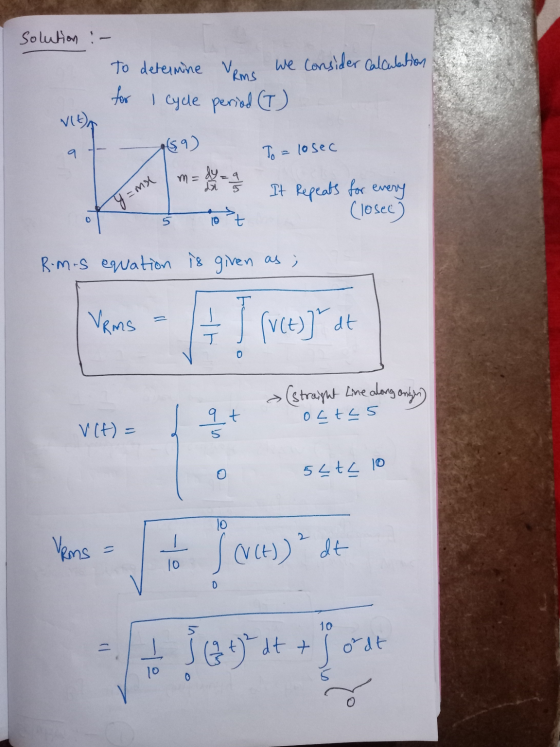
Determine the RMS value of the waveform shown in the figure below. In the figure, the...
Determine the RMS value of the waveform shown in the figure below. In the figure, the...
 Determine the RMS value of the waveform shown in the figure below. In the figure, the peak voltage is 7V. v(t) 0 5 10 Сл 20 25 30 35
Determine the RMS value of the waveform shown in the figure below. In the figure, the...
 Determine the RMS value of the waveform shown in the figure below. In the figure, the peak voltage is 7V. v(t) 0 5 10 Сл 20 25 30 35
Determine the RMS value of the waveform shown in the figure below. In the figure, the...
 Determine the RMS value of the waveform shown in the figure below. In the figure, the peak voltage is 1V. v(t) 5 10 15 20 25 30 35 0.577
Determine the RMS value of the waveform shown in the figure below. In the figure, the...
 Determine the RMS value of the waveform shown in the figure below. In the figure, the peak voltage is 1V. vít) 0 5 10 15 5 20 25 30 35
Question 4 25 pts Determine the RMS value of the waveform shown in the figure below....
 Question 4 25 pts Determine the RMS value of the waveform shown in the figure below. In the figure, the peak voltage is 4V. v(t) 5 10 15 20 25 30 35 O
Determine the RMS value of the waveform shown in the figure below. In this figure the...
 Determine the RMS value of the waveform shown in the figure below. In this figure the higher voltage level is 10V and the lower voltage level is 2V. vt) 0 5 10 15 20 25 30 35
Question 4 25 pts Determine the RMS value of the waveform shown in the figure below....
 Question 4 25 pts Determine the RMS value of the waveform shown in the figure below. In the figure, the peak voltage is 10V. vít) 5 10 15 20 25 30 35
Calculate the rms value of the waveform shown in the figure below. v(t) (v) 4 3...
 Calculate the rms value of the waveform shown in the figure below. v(t) (v) 4 3 - 0 i 2 3 4 5 6 t(s)
Answer asap b) Suppose the RMS value of the triangular waveform shown is Figure 1 below...
 Answer asap
b) Suppose the RMS value of the triangular waveform shown is Figure 1 below is known to be XaMS 1/3. Find the RMS value of the waveform y(t) shown in Figure 2. 0 2
Answer asap
b) Suppose the RMS value of the triangular waveform shown is Figure 1 below is known to be XaMS 1/3. Find the RMS value of the waveform y(t) shown in Figure 2. 0 2
6.13 The waveform for the current in a 70-μF capacitor is shown in the figure below....
 6.13 The waveform for the current in a 70-μF capacitor is shown
in the figure below. Determine the waveform for the capacitor
voltage.
The waveform for the current in a 70-uF capacitor is shown in the figure below. Determine the waveform for the capacitor voltage i(t) (mA) 14 0 10 20 30 40 t (ms) t <0ms t < 40 ms t z 40ms v (t) -2500? V -4 V 0 t <0ms 2500t V 0 t < 40 ms...
6.13 The waveform for the current in a 70-μF capacitor is shown
in the figure below. Determine the waveform for the capacitor
voltage.
The waveform for the current in a 70-uF capacitor is shown in the figure below. Determine the waveform for the capacitor voltage i(t) (mA) 14 0 10 20 30 40 t (ms) t <0ms t < 40 ms t z 40ms v (t) -2500? V -4 V 0 t <0ms 2500t V 0 t < 40 ms...
 Determine the RMS value of the waveform shown in the figure below. In the figure, the peak voltage is 7V. v(t) 0 5 10 Сл 20 25 30 35
 Determine the RMS value of the waveform shown in the figure below. In the figure, the peak voltage is 7V. v(t) 0 5 10 Сл 20 25 30 35
 Determine the RMS value of the waveform shown in the figure below. In the figure, the peak voltage is 1V. v(t) 5 10 15 20 25 30 35 0.577
 Determine the RMS value of the waveform shown in the figure below. In the figure, the peak voltage is 1V. vít) 0 5 10 15 5 20 25 30 35
 Question 4 25 pts Determine the RMS value of the waveform shown in the figure below. In the figure, the peak voltage is 4V. v(t) 5 10 15 20 25 30 35 O
 Determine the RMS value of the waveform shown in the figure below. In this figure the higher voltage level is 10V and the lower voltage level is 2V. vt) 0 5 10 15 20 25 30 35
 Question 4 25 pts Determine the RMS value of the waveform shown in the figure below. In the figure, the peak voltage is 10V. vít) 5 10 15 20 25 30 35
 Calculate the rms value of the waveform shown in the figure below. v(t) (v) 4 3 - 0 i 2 3 4 5 6 t(s)
 Answer asap
b) Suppose the RMS value of the triangular waveform shown is Figure 1 below is known to be XaMS 1/3. Find the RMS value of the waveform y(t) shown in Figure 2. 0 2
Answer asap
b) Suppose the RMS value of the triangular waveform shown is Figure 1 below is known to be XaMS 1/3. Find the RMS value of the waveform y(t) shown in Figure 2. 0 2
 6.13 The waveform for the current in a 70-μF capacitor is shown
in the figure below. Determine the waveform for the capacitor
voltage.
The waveform for the current in a 70-uF capacitor is shown in the figure below. Determine the waveform for the capacitor voltage i(t) (mA) 14 0 10 20 30 40 t (ms) t <0ms t < 40 ms t z 40ms v (t) -2500? V -4 V 0 t <0ms 2500t V 0 t < 40 ms...
6.13 The waveform for the current in a 70-μF capacitor is shown
in the figure below. Determine the waveform for the capacitor
voltage.
The waveform for the current in a 70-uF capacitor is shown in the figure below. Determine the waveform for the capacitor voltage i(t) (mA) 14 0 10 20 30 40 t (ms) t <0ms t < 40 ms t z 40ms v (t) -2500? V -4 V 0 t <0ms 2500t V 0 t < 40 ms...
Most questions answered within 3 hours.
-
A 0.0510 M solution of an organic acid has an
[H+] of 7.50×10⁻⁴M .
What is...
asked 19 seconds ago -
The completed Lewis structure of CO2 contains a total
of 0,1,2,3,4,5,6,7,8 covalent bonds
and 0,1,2,3,4,5,6,7,8 lone pairs.
NOTE:...
asked 3 minutes ago -
what is the profit-maximizing output condition that a
monopolistically competitive firm must satisfy? a) price charged...
asked 4 minutes ago -
Consider the set of ordered pairs shown below. Assuming that the
regression equation is y=3.513+0.429x and...
asked 26 minutes ago -
1. (A) Write two
structural (constitutional)
isomers of C4H8F2?
Please show all of
the
asked 28 minutes ago -
Objective: Practice converting a Boolean logic
expression into it’s truth table and to show the implementation...
asked 25 minutes ago -
1) Name the three holes located in the greater wing of the
sphenoid bone in order...
asked 28 minutes ago -
For the following reaction set-up, which type of hydrocarbon
product would form? 1,4-hexadiene + two Cl2...
asked 31 minutes ago -
Consider the following method that is intended to determine if
the double values d1 and d2...
asked 43 minutes ago -
could someone please post clear drawings of the three structures
in the equilibrium mixture of D-glucose...
asked 50 minutes ago -
Using the Properties of Order show that 5n5 +
4n4 + 6n3 + 2n2+ n +...
asked 54 minutes ago -
What is experiential learning and how is it helpful for teaching
leadership, and interpreting group dynamics?...
asked 53 minutes ago