
Homework Answers
Add Answer to:
As of June 2020, the United States has the following labor statistics: Working Age Population: 260,204,000...
As of June 2020, the United States has the following labor statistics: Working Age Population: 260,204,000...
 As of June 2020, the United States has the following labor statistics: Working Age Population: 260,204,000 Labor Force: 159,932,000 Unemployed Persons: 22,100,000 Calculate the unemployment rate, rounding your answer to the nearest tenth (don't add the percent symbol, just the numbers).
As of June 2020, the Chicago metro area has the following labor statistics: Population: 9,458,539 Labor...
 As of June 2020, the Chicago metro area has the following labor statistics: Population: 9,458,539 Labor Force: 5,006,583 Employed Persons: 4,226,275 Calculate the unemployment rate, rounding your answer to the nearest tenth (don't add the percent symbol, just the numbers).
The United States Bureau of Labor Statistics (BLS) categorizes individuals in the United States into three...
 The United States Bureau of Labor Statistics (BLS) categorizes individuals in the United States into three broad groups based on their employment status. Categorize each individual as employed, unemployed, or not in the labor force according to BLS standards. Employed Unemployed Not in the labor force Answer Bank Brian is a 31-year-old who would like a job, is available to work, and most recently sought work six weeks ago. Sarah is a 72-ycar-old retiree who has no intention of returning...
QUESTION 50 . 1 POINT Suppose the adult working-age population is 280.1 million and the labor...
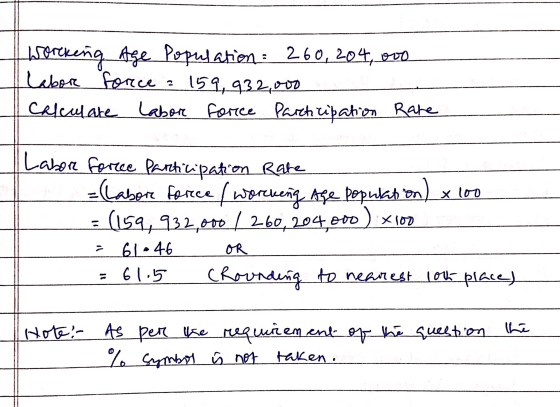
 QUESTION 50 . 1 POINT Suppose the adult working-age population is 280.1 million and the labor force is 181.7 million. What is the labor force participation rate? Round your answer to the nearest tenth. Provide your answer below: FEEDBACK
Find the working-age population, labor force, number of employed workers, and number of unemployed workers. Ellen...
 Find the working-age population, labor force, number of
employed workers, and number of unemployed workers.
Ellen is downloading labor market data for the most recent month, but her connection is slow. So far this is all she has been able to collect: Unemployment rate | 56% | Participation rate 62.5% Not in the labor force61.5 million Find the working-age population, the labor force, the number of employed workers, and the number of unemployed workers. Instructions: Enter your responses rounded to...
Find the working-age population, labor force, number of
employed workers, and number of unemployed workers.
Ellen is downloading labor market data for the most recent month, but her connection is slow. So far this is all she has been able to collect: Unemployment rate | 56% | Participation rate 62.5% Not in the labor force61.5 million Find the working-age population, the labor force, the number of employed workers, and the number of unemployed workers. Instructions: Enter your responses rounded to...
in 2007 the us labor force was equal to thousands QUESTION 1 Refer to the data...
 in 2007 the us labor force was equal to thousands
QUESTION 1 Refer to the data in the table to answer all of the questions that follow. All of the numbers are from the Bureau of Labor Statistics. The Civilian Noninstitutional Population' is defined as "persons 16 years of age and older residing in the 50 states and the District of Columbia who do not live in institutions (for example. correctional facilities, long-term care hospitals, and nursing homes) and who...
in 2007 the us labor force was equal to thousands
QUESTION 1 Refer to the data in the table to answer all of the questions that follow. All of the numbers are from the Bureau of Labor Statistics. The Civilian Noninstitutional Population' is defined as "persons 16 years of age and older residing in the 50 states and the District of Columbia who do not live in institutions (for example. correctional facilities, long-term care hospitals, and nursing homes) and who...
The United States has a population of 327 million and has 206 million people that are...
The United States has a population of 327 million and has 206 million people that are of working age within the population. Of those 206 million people, 153.5 million are employed and 6.5 million are unemployed. The equilibrium real wage is $22 (with economy wide price level P = 1). Q 3. Calculate the employment rate and label it on the graph.
The table describes hypothetical employment statistics in the United States in a given year. The labor...
 The table describes hypothetical employment statistics in the United States in a given year. The labor force is the sum of those that are employed plus the unemployed. Labor Full-time workers and UnderemployedDiscouraged force voluntary part-workers workersworkers million5 million 155 140 million million Based on the information, what is the unemployment rate? Specify your answer to one decimal place unemployment rate
The table describes hypothetical employment statistics in the United States in a given year. The labor...
 The table describes hypothetical employment statistics in the United States in a given year. The labor force is the sum of those that are employed plus the unemployed. Labor Full-time workers and UnderemployedDiscouraged force voluntary part-workers 155 million workers workers 140 million 7 mion 5 mon Based on the information, what is the unemployment rate? Specify your answer to one decimal place. unemployment rate: 5.2
2. Labor Force Participation 75 % #Unemployed =50 million #Working Age Population 200 Million A) Calculate:...
 2. Labor Force Participation 75 % #Unemployed =50 million #Working Age Population 200 Million A) Calculate: #Employed, #Labor Force, #Not in Labor Force and Unemployment Rate B) If the economy was in recession and is now starting an expansion would we expect unemployment to increase or decrease? Which types of unemployment should change? C) The next unemployment numbers are reported and unemployment rises, is this consistent with your estímate in B? Explain why the increase in unemployment may be due...
 As of June 2020, the United States has the following labor statistics: Working Age Population: 260,204,000 Labor Force: 159,932,000 Unemployed Persons: 22,100,000 Calculate the unemployment rate, rounding your answer to the nearest tenth (don't add the percent symbol, just the numbers).
 As of June 2020, the Chicago metro area has the following labor statistics: Population: 9,458,539 Labor Force: 5,006,583 Employed Persons: 4,226,275 Calculate the unemployment rate, rounding your answer to the nearest tenth (don't add the percent symbol, just the numbers).
 The United States Bureau of Labor Statistics (BLS) categorizes individuals in the United States into three broad groups based on their employment status. Categorize each individual as employed, unemployed, or not in the labor force according to BLS standards. Employed Unemployed Not in the labor force Answer Bank Brian is a 31-year-old who would like a job, is available to work, and most recently sought work six weeks ago. Sarah is a 72-ycar-old retiree who has no intention of returning...
 QUESTION 50 . 1 POINT Suppose the adult working-age population is 280.1 million and the labor force is 181.7 million. What is the labor force participation rate? Round your answer to the nearest tenth. Provide your answer below: FEEDBACK
 Find the working-age population, labor force, number of
employed workers, and number of unemployed workers.
Ellen is downloading labor market data for the most recent month, but her connection is slow. So far this is all she has been able to collect: Unemployment rate | 56% | Participation rate 62.5% Not in the labor force61.5 million Find the working-age population, the labor force, the number of employed workers, and the number of unemployed workers. Instructions: Enter your responses rounded to...
Find the working-age population, labor force, number of
employed workers, and number of unemployed workers.
Ellen is downloading labor market data for the most recent month, but her connection is slow. So far this is all she has been able to collect: Unemployment rate | 56% | Participation rate 62.5% Not in the labor force61.5 million Find the working-age population, the labor force, the number of employed workers, and the number of unemployed workers. Instructions: Enter your responses rounded to...
 in 2007 the us labor force was equal to thousands
QUESTION 1 Refer to the data in the table to answer all of the questions that follow. All of the numbers are from the Bureau of Labor Statistics. The Civilian Noninstitutional Population' is defined as "persons 16 years of age and older residing in the 50 states and the District of Columbia who do not live in institutions (for example. correctional facilities, long-term care hospitals, and nursing homes) and who...
in 2007 the us labor force was equal to thousands
QUESTION 1 Refer to the data in the table to answer all of the questions that follow. All of the numbers are from the Bureau of Labor Statistics. The Civilian Noninstitutional Population' is defined as "persons 16 years of age and older residing in the 50 states and the District of Columbia who do not live in institutions (for example. correctional facilities, long-term care hospitals, and nursing homes) and who...
 The table describes hypothetical employment statistics in the United States in a given year. The labor force is the sum of those that are employed plus the unemployed. Labor Full-time workers and UnderemployedDiscouraged force voluntary part-workers workersworkers million5 million 155 140 million million Based on the information, what is the unemployment rate? Specify your answer to one decimal place unemployment rate
 The table describes hypothetical employment statistics in the United States in a given year. The labor force is the sum of those that are employed plus the unemployed. Labor Full-time workers and UnderemployedDiscouraged force voluntary part-workers 155 million workers workers 140 million 7 mion 5 mon Based on the information, what is the unemployment rate? Specify your answer to one decimal place. unemployment rate: 5.2
 2. Labor Force Participation 75 % #Unemployed =50 million #Working Age Population 200 Million A) Calculate: #Employed, #Labor Force, #Not in Labor Force and Unemployment Rate B) If the economy was in recession and is now starting an expansion would we expect unemployment to increase or decrease? Which types of unemployment should change? C) The next unemployment numbers are reported and unemployment rises, is this consistent with your estímate in B? Explain why the increase in unemployment may be due...
Most questions answered within 3 hours.
-
The mean cost of domestic airfares in the United States rose to
an all-time high of...
asked 6 minutes ago -
1.Magazine Luiza is a Brazilian retail chain for consumer
electronics. The company currently has 100 stores...
asked 5 minutes ago -
What is the molarity of ZnCl2 that forms when 25.0 g of zinc
completely reacts with...
asked 7 minutes ago -
For independent X and Y, we have probability density function
for them where pdf of X...
asked 17 minutes ago -
The decomposition of SO2Cl2 is first order in SO2Cl2 and has a
rate constant of 1.42...
asked 13 minutes ago -
How do I convert from volume percent to mole percent in the
distillation lab? ethy acetate...
asked 20 minutes ago -
8. An air-plane has an effective wing surface area of 14.0 m²
that is generating the...
asked 21 minutes ago -
A railroad worker was a person who worked on setting and moving
railroad tracks. In securing...
asked 19 minutes ago -
using RECURSIVE Functions in Java, create a public static String
doubleLetters (String word)
For ex) that...
asked 26 minutes ago -
With a $16 Trillion national ebt, and projected annual budget
eficits in excess of $1 Trillion...
asked 41 minutes ago -
A machine shop owner wishes to assign each of three machinists
(labeled 1, 2, and 3)...
asked 55 minutes ago -
Regarding language development, which of the following
statements is FALSE?
Babies are able to cry from...
asked 54 minutes ago