A)FIND THE CRITICAL VALUES
B)Is there sufficient evidence to conclude that there is a linear correlation between the two variables?
Homework Answers
| X | Y |
| 61 95 45 31 195 100 94 |
70 63 47 55 696 142 48 |
| X - Mx | Y - My | (X - Mx)2 | (Y - My)2 | (X - Mx)(Y - My) |
|
-27.714 Mx: 88.714 |
-90.143 My: 160.143 |
768.082 Sum: 17501.429 |
8125.735 Sum: 341466.857 |
2498.245 Sum: 69058.286 |
Key
X: X Values
Y: Y Values
Mx: Mean of X Values
My: Mean of Y Values
X - Mx & Y -
My: Deviation scores
(X - Mx)2 & (Y -
My)2: Deviation
Squared
(X - Mx)(Y -
My): Product of Deviation Scores
Result Details & Calculation
X Values
∑ = 621
Mean = 88.714
∑(X - Mx)2 = SSx = 17501.429
Y Values
∑ = 1121
Mean = 160.143
∑(Y - My)2 = SSy =
341466.857
X and Y Combined
N = 7
∑(X - Mx)(Y - My) = 69058.286
R Calculation
r = ∑((X - My)(Y - Mx)) /
√((SSx)(SSy))
r = 69058.286 / √((17501.429)(341466.857)) =
0.893
b)
n=7
| Significance Level: | 0.05 |
| Degrees of Freedom:(n-2) | 5 |
Critical value (two tailed) = +/- 0.754
Critical value (one -tailed)= 0.669.
Thank You...|||
please do not forgot to like.
Add Answer to:
A)FIND THE CRITICAL VALUES
B)Is there sufficient evidence to conclude that there is a
linear correlation...
B) FIND CRITICAL VALUES C) Is there sufficient evidence to conclude that there is a linear...
 B) FIND CRITICAL VALUES
C) Is there sufficient evidence to conclude that there is a
linear correlation between the two variables?
The data below shows the annual salaries (in millions) and the number of viewers (in millions) of eight television actors and actresses. Answer parts a-c. 99 12 15 Salary (x) Viewers (y) 14 4.5 31 1.8 10 9.5 6 13.2 3 4.8 12 5.2 10.2 Click here to view a table of critical values for the correlation coefficient. a....
B) FIND CRITICAL VALUES
C) Is there sufficient evidence to conclude that there is a
linear correlation between the two variables?
The data below shows the annual salaries (in millions) and the number of viewers (in millions) of eight television actors and actresses. Answer parts a-c. 99 12 15 Salary (x) Viewers (y) 14 4.5 31 1.8 10 9.5 6 13.2 3 4.8 12 5.2 10.2 Click here to view a table of critical values for the correlation coefficient. a....
B) CRITICAL VALUES C) Is there sufficient evidence to conclude that there is a linear correlation...
 B) CRITICAL VALUES
C) Is there sufficient evidence to conclude that there is a
linear correlation between the two variables?
The data below shows the selling price (in hundred thousands) and the list price (in hundred thousands) of homes sold. Answer parts a-c. Selling Price (x) List Price (y) 400 410 303 317 380 385 430 440 455 485 480 477 318 320 354 370 416 431 333 342 Click here to view a table of critical values for the...
B) CRITICAL VALUES
C) Is there sufficient evidence to conclude that there is a
linear correlation between the two variables?
The data below shows the selling price (in hundred thousands) and the list price (in hundred thousands) of homes sold. Answer parts a-c. Selling Price (x) List Price (y) 400 410 303 317 380 385 430 440 455 485 480 477 318 320 354 370 416 431 333 342 Click here to view a table of critical values for the...
B) critical values C)Is there sufficient evidence to conclude that there is a linear correlation between...
 B) critical values
C)Is there sufficient evidence to conclude that there is a
linear correlation between the two variables?
The data below shows the high temperatures and the times (in minutes) runners who won a marathon. Answer parts a-c. Temperature (x) 56 63 47 64 Time (y) 145.687 144.156 144.086 148.362 70 147.244 75 148.207 51 146.538 60 148.892 Click here to view a table of critical values for the correlation coefficient. a. Find the value of the linear correlation...
B) critical values
C)Is there sufficient evidence to conclude that there is a
linear correlation between the two variables?
The data below shows the high temperatures and the times (in minutes) runners who won a marathon. Answer parts a-c. Temperature (x) 56 63 47 64 Time (y) 145.687 144.156 144.086 148.362 70 147.244 75 148.207 51 146.538 60 148.892 Click here to view a table of critical values for the correlation coefficient. a. Find the value of the linear correlation...
B) FIND THE CRITICAL VALUES C) Is there sufficient evidence to conclude that there is a...
 B) FIND THE CRITICAL VALUES
C) Is there sufficient evidence to conclude that there is a
linear correlation between the two variables?
The blood pressure measurements of a single patient were taken by twelve different medical students and the results are listed below. Answer parts a-c. systolic (x) diastolic (y) 135 92 132 94 141 101 120 84 126 87 120 81 129 84 132 84 131 79 143 95 143 105 137 90 Click here to view a table...
B) FIND THE CRITICAL VALUES
C) Is there sufficient evidence to conclude that there is a
linear correlation between the two variables?
The blood pressure measurements of a single patient were taken by twelve different medical students and the results are listed below. Answer parts a-c. systolic (x) diastolic (y) 135 92 132 94 141 101 120 84 126 87 120 81 129 84 132 84 131 79 143 95 143 105 137 90 Click here to view a table...
B) FIND THE CRITICAL VALUES C) Is there sufficient evidence to conclude that there is a...
 B) FIND THE CRITICAL VALUES
C) Is there sufficient evidence to conclude that there is a linear
correlation between the two variables?
The eruption height and the time interval after eruption of a geyser were measured and are shown below. Answer parts a-c. Height (x) Interval after (y) 112 64 140 75 115 59 140 73 130 71 110 56 100 54 120 68 Click here to view a table of critical values for the correlation coefficient. a. Find the...
B) FIND THE CRITICAL VALUES
C) Is there sufficient evidence to conclude that there is a linear
correlation between the two variables?
The eruption height and the time interval after eruption of a geyser were measured and are shown below. Answer parts a-c. Height (x) Interval after (y) 112 64 140 75 115 59 140 73 130 71 110 56 100 54 120 68 Click here to view a table of critical values for the correlation coefficient. a. Find the...
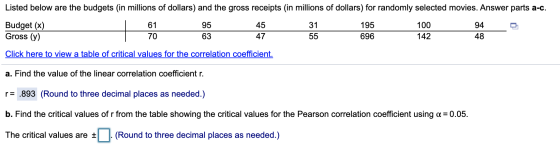
Listed below are the budgets (in millions of dollars) and the gross receipts (in millions of...
Listed below are the budgets (in millions of dollars) and the gross receipts (in millions of dollars) for randomly selected movies. Answer parts a-c. Budget (x) 62 88 52 39 191 105 87 Gross (y) 67 69 44 55 617 143 47 Click here to view a table of critical values for the correlation coefficient. LOADING... a. Find the value of the linear correlation coefficient r. requals nothing (Round to three decimal places as needed.)
How do you determine if there is sufficient evidence or if there is a significant linear...
 How do you determine if there is sufficient evidence or if there
is a significant linear correlation?
The accompanying table shows eleven altitudes (in thousands of feet) and the speeds of sound in feet per second) at these altitudes. Complete parts (a) through (d) below. Click here to view the data table. Click here to view the table of critical values for the Pearson correlation coefficient. (a) Display the data in a scatter plot. Choose the correct graph below. OA...
How do you determine if there is sufficient evidence or if there
is a significant linear correlation?
The accompanying table shows eleven altitudes (in thousands of feet) and the speeds of sound in feet per second) at these altitudes. Complete parts (a) through (d) below. Click here to view the data table. Click here to view the table of critical values for the Pearson correlation coefficient. (a) Display the data in a scatter plot. Choose the correct graph below. OA...
Listed below are the budgets (in millions of dollars) and the gross receipts (in millions of...
Listed below are the budgets (in millions of dollars) and the gross receipts (in millions of dollars) for randomly selected movies. Construct a scatterplot, find the value of the linear correlation coefficient r, and find the P-value using alpha equals0.05. Budget_(x) Gross_(y) 61 66 88 69 53 51 40 56 203 598 101 141 85 48 Is there sufficient evidence to conclude that there is a linear correlation between budgets and gross receipts? Do the results change if the actual...
and find the Palue using -0.05. Is there sufficient evidence to conclude that there is a...
 and find the Palue using -0.05. Is there sufficient evidence to conclude that there is a linear correlation between lemorn O A. ОВ. o c. a scaterplot, find the vakue of the linear correlation ooefficient r, and ind the P-value using a- 0.08 Is there suficient evidence to conclude that there is a linear corelation between lemon imports and crash fstality rates? Do the results suggest that imported lemons The Inear comelation coefficient r is Round to three decimal places...
Use the given confidence level and sample data to find (a) the margin of error and...
 Use the given confidence level and sample data to find (a) the margin of error and (b) the confidence interval for the population mean u. Assume that the population has a normal distribution. Weight lost on a diet: 90% confidence; n 20, x= 7.0 kg, s 9.2 kg. Click the icon to view a table of critical t-values. kg (Round to one decimal place as needed.) (a) E (b) What is the confidence interval for the population mean u? kg<u...
 B) FIND CRITICAL VALUES
C) Is there sufficient evidence to conclude that there is a
linear correlation between the two variables?
The data below shows the annual salaries (in millions) and the number of viewers (in millions) of eight television actors and actresses. Answer parts a-c. 99 12 15 Salary (x) Viewers (y) 14 4.5 31 1.8 10 9.5 6 13.2 3 4.8 12 5.2 10.2 Click here to view a table of critical values for the correlation coefficient. a....
B) FIND CRITICAL VALUES
C) Is there sufficient evidence to conclude that there is a
linear correlation between the two variables?
The data below shows the annual salaries (in millions) and the number of viewers (in millions) of eight television actors and actresses. Answer parts a-c. 99 12 15 Salary (x) Viewers (y) 14 4.5 31 1.8 10 9.5 6 13.2 3 4.8 12 5.2 10.2 Click here to view a table of critical values for the correlation coefficient. a....
 B) CRITICAL VALUES
C) Is there sufficient evidence to conclude that there is a
linear correlation between the two variables?
The data below shows the selling price (in hundred thousands) and the list price (in hundred thousands) of homes sold. Answer parts a-c. Selling Price (x) List Price (y) 400 410 303 317 380 385 430 440 455 485 480 477 318 320 354 370 416 431 333 342 Click here to view a table of critical values for the...
B) CRITICAL VALUES
C) Is there sufficient evidence to conclude that there is a
linear correlation between the two variables?
The data below shows the selling price (in hundred thousands) and the list price (in hundred thousands) of homes sold. Answer parts a-c. Selling Price (x) List Price (y) 400 410 303 317 380 385 430 440 455 485 480 477 318 320 354 370 416 431 333 342 Click here to view a table of critical values for the...
 B) critical values
C)Is there sufficient evidence to conclude that there is a
linear correlation between the two variables?
The data below shows the high temperatures and the times (in minutes) runners who won a marathon. Answer parts a-c. Temperature (x) 56 63 47 64 Time (y) 145.687 144.156 144.086 148.362 70 147.244 75 148.207 51 146.538 60 148.892 Click here to view a table of critical values for the correlation coefficient. a. Find the value of the linear correlation...
B) critical values
C)Is there sufficient evidence to conclude that there is a
linear correlation between the two variables?
The data below shows the high temperatures and the times (in minutes) runners who won a marathon. Answer parts a-c. Temperature (x) 56 63 47 64 Time (y) 145.687 144.156 144.086 148.362 70 147.244 75 148.207 51 146.538 60 148.892 Click here to view a table of critical values for the correlation coefficient. a. Find the value of the linear correlation...
 B) FIND THE CRITICAL VALUES
C) Is there sufficient evidence to conclude that there is a
linear correlation between the two variables?
The blood pressure measurements of a single patient were taken by twelve different medical students and the results are listed below. Answer parts a-c. systolic (x) diastolic (y) 135 92 132 94 141 101 120 84 126 87 120 81 129 84 132 84 131 79 143 95 143 105 137 90 Click here to view a table...
B) FIND THE CRITICAL VALUES
C) Is there sufficient evidence to conclude that there is a
linear correlation between the two variables?
The blood pressure measurements of a single patient were taken by twelve different medical students and the results are listed below. Answer parts a-c. systolic (x) diastolic (y) 135 92 132 94 141 101 120 84 126 87 120 81 129 84 132 84 131 79 143 95 143 105 137 90 Click here to view a table...
 B) FIND THE CRITICAL VALUES
C) Is there sufficient evidence to conclude that there is a linear
correlation between the two variables?
The eruption height and the time interval after eruption of a geyser were measured and are shown below. Answer parts a-c. Height (x) Interval after (y) 112 64 140 75 115 59 140 73 130 71 110 56 100 54 120 68 Click here to view a table of critical values for the correlation coefficient. a. Find the...
B) FIND THE CRITICAL VALUES
C) Is there sufficient evidence to conclude that there is a linear
correlation between the two variables?
The eruption height and the time interval after eruption of a geyser were measured and are shown below. Answer parts a-c. Height (x) Interval after (y) 112 64 140 75 115 59 140 73 130 71 110 56 100 54 120 68 Click here to view a table of critical values for the correlation coefficient. a. Find the...
 How do you determine if there is sufficient evidence or if there
is a significant linear correlation?
The accompanying table shows eleven altitudes (in thousands of feet) and the speeds of sound in feet per second) at these altitudes. Complete parts (a) through (d) below. Click here to view the data table. Click here to view the table of critical values for the Pearson correlation coefficient. (a) Display the data in a scatter plot. Choose the correct graph below. OA...
How do you determine if there is sufficient evidence or if there
is a significant linear correlation?
The accompanying table shows eleven altitudes (in thousands of feet) and the speeds of sound in feet per second) at these altitudes. Complete parts (a) through (d) below. Click here to view the data table. Click here to view the table of critical values for the Pearson correlation coefficient. (a) Display the data in a scatter plot. Choose the correct graph below. OA...
 and find the Palue using -0.05. Is there sufficient evidence to conclude that there is a linear correlation between lemorn O A. ОВ. o c. a scaterplot, find the vakue of the linear correlation ooefficient r, and ind the P-value using a- 0.08 Is there suficient evidence to conclude that there is a linear corelation between lemon imports and crash fstality rates? Do the results suggest that imported lemons The Inear comelation coefficient r is Round to three decimal places...
 Use the given confidence level and sample data to find (a) the margin of error and (b) the confidence interval for the population mean u. Assume that the population has a normal distribution. Weight lost on a diet: 90% confidence; n 20, x= 7.0 kg, s 9.2 kg. Click the icon to view a table of critical t-values. kg (Round to one decimal place as needed.) (a) E (b) What is the confidence interval for the population mean u? kg<u...
Most questions answered within 3 hours.
-
Given the following table of high speed internet access vs.
annual home income:
Home Income
%...
asked 23 minutes ago -
A baseball batter hits a 0.145kg baseball straight up into the
air. The baseball leaves the...
asked 55 minutes ago -
An FM modulator is tested using
single-tone baseband signal with frequency of 50kHz and a sprectrum...
asked 1 hour ago -
Write the ionic equations for the first stage of salts
hydrolysis.
Anion, Cation?
Na2S
NiSO4
K2SO4...
asked 2 hours ago -
suppose there is a normally distributed population with a mean of
250 and a standard deviation...
asked 3 hours ago -
Question Three
Suppose you as project manager are using the Waterfall
development methodology on a large...
asked 4 hours ago -
Which statement is not true about welfare in Canada?
A.Benefits typically vary based on one's ability...
asked 5 hours ago -
Please help me with FLOWCHART and UML diagram for class,
thank you!
#include <iostream>
#include <fstream>...
asked 5 hours ago -
3. Describe the “logic circuit” of the Lac operon. Which
proteins are bound or not to...
asked 5 hours ago -
Ayesha’s adjusted gross income is $60,000 in 2019. She donated a
piece of artwork with a...
asked 5 hours ago -
For Dijkstra’s shortest path algorithm:
a. Give the Big-O time for Dijkstra’s shortest path algorithm
and...
asked 6 hours ago -
Phosphorus violates the 'octet rule' in biological molecules,
forming more covalent bonds than expected based on...
asked 6 hours ago