Listed below are the budgets (in millions of dollars) and the gross receipts (in millions of...
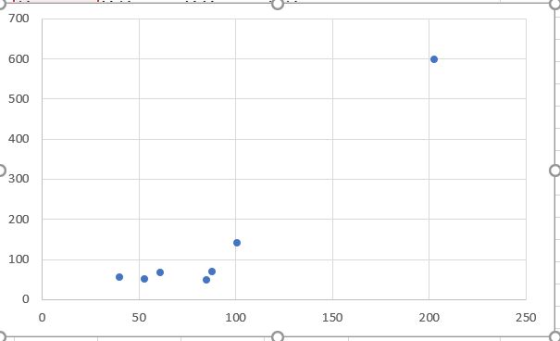
Listed below are the budgets (in millions of dollars) and the gross receipts (in millions of dollars) for randomly selected movies. Construct a scatterplot, find the value of the linear correlation coefficient r, and find the P-value using
alpha
equals0.05.
Budget_(x) Gross_(y)
61 66
88 69
53 51
40 56
203 598
101 141
85 48
Is there sufficient evidence to conclude that there is a linear correlation between budgets and gross receipts? Do the results change if the actual budgets listed are
$61 comma 000 comma 000
,
$88 comma 000 comma 000
,
$53 comma 000 comma 000
,
and so on?
What are the null and alternative hypotheses?
Construct a scatterplot. Choose the correct graph below.
The linear correlation coefficient r is
(Round to three decimal places as needed.)
The test statistic t is
(Round to two decimal places as needed.)
The P-value is
(Round to three decimal places as needed.)
Because the P-value is
▼
greater
less
then the significance level
0.05
,
there
▼
is
is not
sufficient evidence to support the claim that there is a linear correlation between budgets and gross receipts for a significance level of
alpha
equals0.05
.
Do the results change if the actual budgets listed are
$61 comma 000 comma 000
,
$88 comma 000 comma 000
,
$53 comma 000 comma 000
,
and so on?
A.
No, the results do not change because it would result in a different linear correlation coefficient.
B.
Yes, the results would need to be multiplied by 1,000,000.
C.
Yes, the results would change because it would result in a different linear correlation coefficient.
D.
No, the results do not change because it would result in the same linear correlation coefficient.
ASAP
Homework Answers
a) Scatter Plot
b) Correlation Coefficient

The Correlation Coefficient is r = 0.947
c) Hypothesis Testing
Null Hypothesis 
ALternative Hypothesis 
Under H0, the test statistic is

Degrees of Freedom = n-2 = 5
Significance Level 
The p value is 0.001
Answer: Because the P-value is less then the significance level
0.05 there is sufficient evidence to support the claim that there
is a linear correlation between budgets and gross receipts for a
significance level of
d) Answer: D. No, the results do not change because it would result in the same linear correlation coefficient.
Add Answer to:
Listed below are the budgets (in millions of dollars) and the
gross receipts (in millions of...
Listed below are the budgets (in millions of dollars) and the gross receipts (in millions of...
Listed below are the budgets (in millions of dollars) and the gross receipts (in millions of dollars) for randomly selected movies. Answer parts a-c. Budget (x) 62 88 52 39 191 105 87 Gross (y) 67 69 44 55 617 143 47 Click here to view a table of critical values for the correlation coefficient. LOADING... a. Find the value of the linear correlation coefficient r. requals nothing (Round to three decimal places as needed.)
Do the results change if the actual budgets listed are 64,000,000, 93,000,000, 46,000,000, and so on?...
 Do the results change if the actual budgets listed are
64,000,000,
93,000,000,
46,000,000,
and so on?
A.
No, the results do not change because it would result in the
same linear correlation coefficient.
B.
Yes, the results would need to be multiplied by 1,000,000.
C.
Yes, the results would change because it would result in a
different linear correlation coefficient.
D.
No, the results do not change because it would result in a
different linear correlation coefficient.
*** What are...
Do the results change if the actual budgets listed are
64,000,000,
93,000,000,
46,000,000,
and so on?
A.
No, the results do not change because it would result in the
same linear correlation coefficient.
B.
Yes, the results would need to be multiplied by 1,000,000.
C.
Yes, the results would change because it would result in a
different linear correlation coefficient.
D.
No, the results do not change because it would result in a
different linear correlation coefficient.
*** What are...
5. Calculate the minimum required sample size. a. See number 3 above. 6. Given a set...
 5. Calculate the minimum required sample size. a. See number 3 above. 6. Given a set of ordered pair data calculate the correlation coefficient. r. calculate and interpret the coefficient of determination find the equation of the regression line, and make a prediction. a. Listed below are the budgets (in millions of dollars) and the gross receipts (in millions of dollars) for randomly selected movies. Construct a scatterplot find the value of the linear correlation coefficient r, and find the...
A)FIND THE CRITICAL VALUES B)Is there sufficient evidence to conclude that there is a linear correlation...
 A)FIND THE CRITICAL VALUES
B)Is there sufficient evidence to conclude that there is a
linear correlation between the two variables?
Listed below are the budgets (in millions of dollars) and the gross receipts (in millions of dollars) for randomly selected movies. Answer parts a-c. Budget (x) Gross (y) 61 70 95 63 45 47 31 55 195 696 100 142 94 48 Click here to view a table of critical values for the correlation coefficient. a. Find the value of...
A)FIND THE CRITICAL VALUES
B)Is there sufficient evidence to conclude that there is a
linear correlation between the two variables?
Listed below are the budgets (in millions of dollars) and the gross receipts (in millions of dollars) for randomly selected movies. Answer parts a-c. Budget (x) Gross (y) 61 70 95 63 45 47 31 55 195 696 100 142 94 48 Click here to view a table of critical values for the correlation coefficient. a. Find the value of...
Listed below are the overhead widths (in cm) of seals measured from photographs and the weights...
 Listed below are the overhead widths (in cm) of seals measured from photographs and the weights (in kg) of the seals. Construct a scatterplot, find the value of the linear correlation coefficient r, and find the critical values of r using a=0.01. Is there sufficient evidence to conclude that there is a linear correlation between overhead widths of seals from photographs and the weights of the seals? Overhead Width 72 7.8 9.7 9.4 8.7 8.3 Weight 117 205 241 201...
Listed below are the overhead widths (in cm) of seals measured from photographs and the weights...
 Listed below are the overhead widths (in cm) of seals measured from photographs and the weights (in kg) of the seals. Construct a scatterplot, find the value of the linear correlation coefficient r, and find the critical values of r using a = 0.05. Is there sufficient evidence to conclude that there is a linear correlation between overhead widths of seals from photographs and the weights of the seals? Overhead Width 7.1 7.7 9.8 9.2 8.9 8.1 Weight 115 171...
Listed below are the overhead widths (in cm) of seals measured from photographs and the weights (in kg) of the seals. Construct a scatterplot, find the value of the linear correlation coefficient r,...
 Listed below are the overhead widths (in cm) of seals measured from photographs and the weights (in kg) of the seals. Construct a scatterplot, find the value of the linear correlation coefficient r, and find the critical values of r using α= 0.05, is there sufficient evidence to conclude that there is a linear correlation between overhea widths of seals from photographs and the weights of the seals? 8.2 114 168 24693 209 183 9.8 9.2 8.9 Overhead Width 7.1...
Listed below are numbers of Internet users per 100 people and numbers of scientific award winners per 10 million people...
 Listed below are numbers of Internet users per 100 people and numbers of scientific award winners per 10 million people for different countries. Construct a scatterplot, find the value of the linear correlation coefficient r, and find the P-value of r. Determine whether there is sufficient evidence to support a claim of linear correlation between the two variables. Use a significance level of α-0.01 Internet Users 79.1 80.4 55.7 67.5 79.5 37.6 Award Winners 5.4 8.8 3.2 1.7 11.1 0.1...
Listed below are paired data consisting of amounts spent on advertising (in millions of dollars) and...
Listed below are paired data consisting of amounts spent on advertising (in millions of dollars) and the profits (in millions of dollars). Determine if there is a significant positive linear correlation between advertising cost and profit. Use a significance level of 0.06 and round all values to 4 decimal places. Advertising Cost Profit 3 17 4 24 5 25 6 18 7 29 8 23 9 28 10 34 11 35 R vector x values: 3,4,5,6,7,8,9,10,11 R vector y values:...
Listed below are numbers of Internet users per 100 people and numbers of scientific award winners...
 Listed below are numbers of Internet users per 100 people and numbers of scientific award winners per 10 million people for different countries. Construct a scatterplot, find the value of the linear correlation coefficient r, and find the P-value of r. Determine whether there is sufficient evidence to support a claim of linear correlation between the two variables. Use a significance level of a = 0.05. 79.7 57.3 Internet Users Award Winners 80.1 5.6 68.2 1.8 76.6 11.1 39.1 0.1...
 Do the results change if the actual budgets listed are
64,000,000,
93,000,000,
46,000,000,
and so on?
A.
No, the results do not change because it would result in the
same linear correlation coefficient.
B.
Yes, the results would need to be multiplied by 1,000,000.
C.
Yes, the results would change because it would result in a
different linear correlation coefficient.
D.
No, the results do not change because it would result in a
different linear correlation coefficient.
*** What are...
Do the results change if the actual budgets listed are
64,000,000,
93,000,000,
46,000,000,
and so on?
A.
No, the results do not change because it would result in the
same linear correlation coefficient.
B.
Yes, the results would need to be multiplied by 1,000,000.
C.
Yes, the results would change because it would result in a
different linear correlation coefficient.
D.
No, the results do not change because it would result in a
different linear correlation coefficient.
*** What are...
 5. Calculate the minimum required sample size. a. See number 3 above. 6. Given a set of ordered pair data calculate the correlation coefficient. r. calculate and interpret the coefficient of determination find the equation of the regression line, and make a prediction. a. Listed below are the budgets (in millions of dollars) and the gross receipts (in millions of dollars) for randomly selected movies. Construct a scatterplot find the value of the linear correlation coefficient r, and find the...
 A)FIND THE CRITICAL VALUES
B)Is there sufficient evidence to conclude that there is a
linear correlation between the two variables?
Listed below are the budgets (in millions of dollars) and the gross receipts (in millions of dollars) for randomly selected movies. Answer parts a-c. Budget (x) Gross (y) 61 70 95 63 45 47 31 55 195 696 100 142 94 48 Click here to view a table of critical values for the correlation coefficient. a. Find the value of...
A)FIND THE CRITICAL VALUES
B)Is there sufficient evidence to conclude that there is a
linear correlation between the two variables?
Listed below are the budgets (in millions of dollars) and the gross receipts (in millions of dollars) for randomly selected movies. Answer parts a-c. Budget (x) Gross (y) 61 70 95 63 45 47 31 55 195 696 100 142 94 48 Click here to view a table of critical values for the correlation coefficient. a. Find the value of...
 Listed below are the overhead widths (in cm) of seals measured from photographs and the weights (in kg) of the seals. Construct a scatterplot, find the value of the linear correlation coefficient r, and find the critical values of r using a=0.01. Is there sufficient evidence to conclude that there is a linear correlation between overhead widths of seals from photographs and the weights of the seals? Overhead Width 72 7.8 9.7 9.4 8.7 8.3 Weight 117 205 241 201...
 Listed below are the overhead widths (in cm) of seals measured from photographs and the weights (in kg) of the seals. Construct a scatterplot, find the value of the linear correlation coefficient r, and find the critical values of r using a = 0.05. Is there sufficient evidence to conclude that there is a linear correlation between overhead widths of seals from photographs and the weights of the seals? Overhead Width 7.1 7.7 9.8 9.2 8.9 8.1 Weight 115 171...
 Listed below are the overhead widths (in cm) of seals measured from photographs and the weights (in kg) of the seals. Construct a scatterplot, find the value of the linear correlation coefficient r, and find the critical values of r using α= 0.05, is there sufficient evidence to conclude that there is a linear correlation between overhea widths of seals from photographs and the weights of the seals? 8.2 114 168 24693 209 183 9.8 9.2 8.9 Overhead Width 7.1...
 Listed below are numbers of Internet users per 100 people and numbers of scientific award winners per 10 million people for different countries. Construct a scatterplot, find the value of the linear correlation coefficient r, and find the P-value of r. Determine whether there is sufficient evidence to support a claim of linear correlation between the two variables. Use a significance level of α-0.01 Internet Users 79.1 80.4 55.7 67.5 79.5 37.6 Award Winners 5.4 8.8 3.2 1.7 11.1 0.1...
 Listed below are numbers of Internet users per 100 people and numbers of scientific award winners per 10 million people for different countries. Construct a scatterplot, find the value of the linear correlation coefficient r, and find the P-value of r. Determine whether there is sufficient evidence to support a claim of linear correlation between the two variables. Use a significance level of a = 0.05. 79.7 57.3 Internet Users Award Winners 80.1 5.6 68.2 1.8 76.6 11.1 39.1 0.1...
Most questions answered within 3 hours.
-
In winter a lake has a 0.35 m thick ice layer over 1.10 m of
water....
asked 22 minutes ago -
Assuming the following has been encrypted with a Vigenere cipher
below, use the method(s) and assumptions...
asked 47 minutes ago -
How would I use switch statements to write a program that will
take an input of...
asked 38 minutes ago -
Imagine a reaction in which methane gas combusts at a constant
pressure of 1 atm and...
asked 48 minutes ago -
Two parallel wires (each 12 m in length) are separated by a
distance of 0.065 m...
asked 46 minutes ago -
Suppose there were three masses at the corner of uniform
equilateral triangle. The masses are m1...
asked 48 minutes ago -
Situation: A building that is 618 m above the ground floor. How
many times would a...
asked 52 minutes ago -
help me and discuss one successful and one
unsuccessful international company/busines in Indonesia.whyit
succeed and why...
asked 59 minutes ago -
I- Choose the best answer
Which of the following statements about the structure and
packaging of...
asked 1 hour ago -
1. A sample of 144 incoming freshman found that 45 of them
scored more than 550...
asked 1 hour ago -
Kc is 2.35 × 10¹⁸ at 25 °C for the formation of iron(III)
oxalate complex ion....
asked 1 hour ago -
Team Values – Discuss as a team what values are important.
Develop a statement or itemised...
asked 1 hour ago