

Homework Answers
we want to know if there is difference between the average individual vacation budget of this year and that of last year
for this use Data Analysis tool in excel for t test: Two sample assuming unequal variances. we get the following table
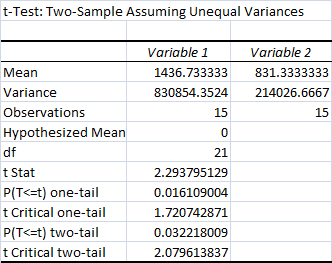
from this table it is observed that  , that is t-statistic =2.2939 is greater than the two sided
critical value. hence it is then concluded that the null
hypothesis is rejected.
, that is t-statistic =2.2939 is greater than the two sided
critical value. hence it is then concluded that the null
hypothesis is rejected.
yes we reject the null hypothesis.
It is concluded that the null hypothesis Ho is rejected. Therefore, there is enough evidence to claim that the average individual vacation budget of this year is different than that of last year, at the 0.05 significance level.
yes there is evidence of difference.
Add Answer to:
Question 9 (1 point) Questions 6-10 is one hypothesis testing problem using an Excel data called...
Question 7 (1 point) Questions 6-10 is one hypothesis testing problem using an Excel data called...
 Question 7 (1 point) Questions 6-10 is one hypothesis testing problem using an Excel data called vacation. We want to know if there is a difference between the average individual vacation budget of this year and that of last year. We collected two independent samples of 15 individuals vacation from each year. We assume population variances are unequal. You already downloaded the data file in Question 6, so you do not have to open it again. Just run a correct...
Question 6 (1 point) Questions 6-10 is one hypothesis testing problem using an Excel data called...
 Question 6 (1 point) Questions 6-10 is one hypothesis testing problem using an Excel data called vacation. Click the file name to download the Excel data file. We want to know if there is a difference between the average individual vacation budget of this year and that of last year. We collected two independent samples of 15 individuals' vacation from each year. We assume population variance are not equal. What is the null hypothesis? O a) H1-H2 = 0 Ob)...
Question 4 (1 point) (Quesitons 1-5 are in one hypothesis testing problem using Teaching Methodology data)....
 Question 4 (1 point) (Quesitons 1-5 are in one hypothesis testing problem using Teaching Methodology data). A teacher of statistics wants to know if a new teaching methodology that includes IT is efficient in terms of increased average score. He took a class with old methodology and a class with new methodology for samples and gave a same test. Once you opened the file in question 1 and ran Excel, you need not open it again. Just use the Excel...
Question 2 (1 point) (Quesitons 1-5 are in one hypothesis problem using Teaching Methodology data) A...
 Question 2 (1 point) (Quesitons 1-5 are in one hypothesis problem using Teaching Methodology data) A teacher of statistics wants to know if a new teaching methodology that includes IT is efficient in terms of increased average score. He took a class with old methodology and a class with new methodology for samples and gave a same test. Once you opened the file in question 1 and ran Excel, you need not open it again. Just use the Excel output...
Question 1 (1 point) ✓ Saved (Quesitons 1-5 are in one hypothesis testing using Teaching Methodology...
 Question 1 (1 point) ✓ Saved (Quesitons 1-5 are in one hypothesis testing using Teaching Methodology data). Click the data file name to download the data A teacher of statistics wants to know if a new teaching methodology that includes IT is efficient in terms of increased average score. He took a class with old methodology and a class with new methodology for samples and gave a same test. Open the file by clicking the file name above. Once you...
Question 2 (1 point) (Quesitons 1-5 are in one hypothesis problem using Teaching Methodology data). A...
 Question 2 (1 point) (Quesitons 1-5 are in one hypothesis problem using Teaching Methodology data). A teacher of statistics wants to know if a new teaching methodology that includes IT is efficient in terms of increased average score. He took a class with old methodology and a class with new methodology for samples and gave a same test. Once you opened the file in question 1 and ran Excel, you need not open it again. Just use the Excel output...
Using the t-Test Exercise Data Set Excel file, Look at the date set of Systolic Blood...
Using the t-Test Exercise Data Set Excel file, Look at the date set of Systolic Blood Pressure Normal Weight/Systolic Blood Pressure Obese Write a null hypothesis for the comparison (use the null hypothesis template). Also, write a directional hypothesis that reflects the anticipated outcome. Conduct a t-test two-sample assuming unequal variances using Excel. Interpret the Excel result (was it significant, what was the critical t-value, what was the calculated t-value, what should be done with the null hypothesis—accept or reject)....
2. Testing two population means using Excel Aa Aa Consider two independent random variables x and...
 2. Testing two population means using Excel Aa Aa Consider two independent random variables x and y. The variable x follows a normal distribution with an unknown population mean ux and a unknown standard deviation of ox. The variable y also follows a normal distribution with an unknown population mean py and a unknown standard deviation of oy. Independent random samples are drawn from each population To answer the questions that follow, download an Excel spreadsheet containing observed values of...
Assignment 3: Hypothesis Testing for the Population Mean The purpose of this activity is to give...
 Assignment 3: Hypothesis Testing for the Population
Mean
The purpose of this activity is to give you guided practice in
going through the process of a t-test for the population mean, and
teach you how to carry out this test using statistical
software.
Background:
A group of 75 college students from a certain liberal arts
college were randomly sampled and asked about the number of
alcoholic drinks they have in a typical week. The file containing
the data is linked...
Assignment 3: Hypothesis Testing for the Population
Mean
The purpose of this activity is to give you guided practice in
going through the process of a t-test for the population mean, and
teach you how to carry out this test using statistical
software.
Background:
A group of 75 college students from a certain liberal arts
college were randomly sampled and asked about the number of
alcoholic drinks they have in a typical week. The file containing
the data is linked...
 Question 7 (1 point) Questions 6-10 is one hypothesis testing problem using an Excel data called vacation. We want to know if there is a difference between the average individual vacation budget of this year and that of last year. We collected two independent samples of 15 individuals vacation from each year. We assume population variances are unequal. You already downloaded the data file in Question 6, so you do not have to open it again. Just run a correct...
 Question 6 (1 point) Questions 6-10 is one hypothesis testing problem using an Excel data called vacation. Click the file name to download the Excel data file. We want to know if there is a difference between the average individual vacation budget of this year and that of last year. We collected two independent samples of 15 individuals' vacation from each year. We assume population variance are not equal. What is the null hypothesis? O a) H1-H2 = 0 Ob)...
 Question 4 (1 point) (Quesitons 1-5 are in one hypothesis testing problem using Teaching Methodology data). A teacher of statistics wants to know if a new teaching methodology that includes IT is efficient in terms of increased average score. He took a class with old methodology and a class with new methodology for samples and gave a same test. Once you opened the file in question 1 and ran Excel, you need not open it again. Just use the Excel...
 Question 2 (1 point) (Quesitons 1-5 are in one hypothesis problem using Teaching Methodology data) A teacher of statistics wants to know if a new teaching methodology that includes IT is efficient in terms of increased average score. He took a class with old methodology and a class with new methodology for samples and gave a same test. Once you opened the file in question 1 and ran Excel, you need not open it again. Just use the Excel output...
 Question 1 (1 point) ✓ Saved (Quesitons 1-5 are in one hypothesis testing using Teaching Methodology data). Click the data file name to download the data A teacher of statistics wants to know if a new teaching methodology that includes IT is efficient in terms of increased average score. He took a class with old methodology and a class with new methodology for samples and gave a same test. Open the file by clicking the file name above. Once you...
 Question 2 (1 point) (Quesitons 1-5 are in one hypothesis problem using Teaching Methodology data). A teacher of statistics wants to know if a new teaching methodology that includes IT is efficient in terms of increased average score. He took a class with old methodology and a class with new methodology for samples and gave a same test. Once you opened the file in question 1 and ran Excel, you need not open it again. Just use the Excel output...
 2. Testing two population means using Excel Aa Aa Consider two independent random variables x and y. The variable x follows a normal distribution with an unknown population mean ux and a unknown standard deviation of ox. The variable y also follows a normal distribution with an unknown population mean py and a unknown standard deviation of oy. Independent random samples are drawn from each population To answer the questions that follow, download an Excel spreadsheet containing observed values of...
 Assignment 3: Hypothesis Testing for the Population
Mean
The purpose of this activity is to give you guided practice in
going through the process of a t-test for the population mean, and
teach you how to carry out this test using statistical
software.
Background:
A group of 75 college students from a certain liberal arts
college were randomly sampled and asked about the number of
alcoholic drinks they have in a typical week. The file containing
the data is linked...
Assignment 3: Hypothesis Testing for the Population
Mean
The purpose of this activity is to give you guided practice in
going through the process of a t-test for the population mean, and
teach you how to carry out this test using statistical
software.
Background:
A group of 75 college students from a certain liberal arts
college were randomly sampled and asked about the number of
alcoholic drinks they have in a typical week. The file containing
the data is linked...
Most questions answered within 3 hours.
-
A coach uses a new technique to train gymnasts. Seven
gymnasts were randomly selected and their...
asked 1 hour ago -
While rotating the tires on your car you notice a rock [mass =
0.1 Kg] stuck...
asked 3 hours ago -
Using MARS simulator, write MIPS programs according to
the following scenarios: Receive a positive integer number...
asked 5 hours ago -
An object in front of a concave mirror has a real image that is
11.5 cm...
asked 5 hours ago -
Consider the reaction, C3 H8 + O2 --> CO2 + H2O. How many
moles of O2...
asked 7 hours ago -
You and your opponent both roll a fair die. If you both roll the
same number,...
asked 7 hours ago -
In a study of the accuracy of fast food drive-through orders,
Restaurant A had 257 accurate...
asked 7 hours ago -
Identify and describe in detail the four categories of
institutions that could be included in a...
asked 7 hours ago -
In python
class Customer:
def __init__(self, customer_id, last_name, first_name, phone_number, address):
self._customer_id = int(customer_id)
self._last_name =...
asked 7 hours ago -
What is an example of a limitation in implementing a new
ERP system and how it...
asked 7 hours ago -
In a section of 9.7cm of an artery with a radius of 2.6mm there
is a...
asked 7 hours ago -
the two carboxylic acid groups of aspartic acid have different
acidities with pKa values of 2.1...
asked 7 hours ago