
Homework Answers
Add Answer to:
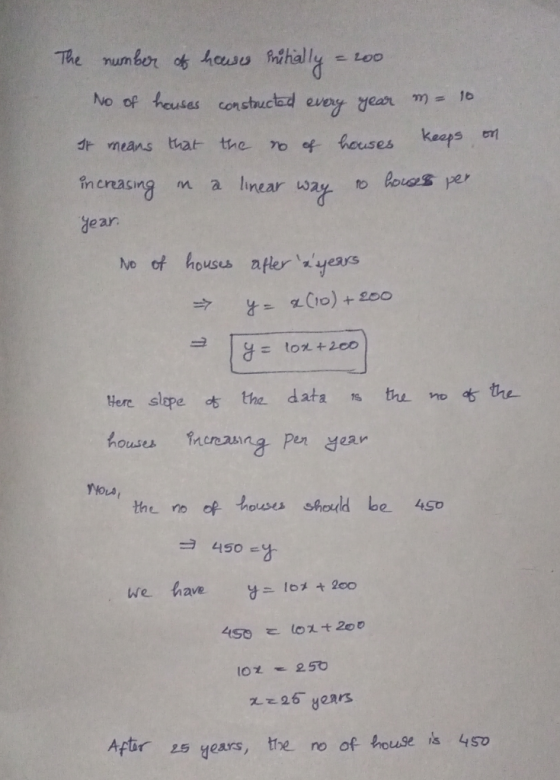
QUESTION 8 The number of houses in a town started at 200. Each year 10 homes...
QUESTION 9 The number of traffic signs in a town starts at 135, after 5 months...
 QUESTION 9 The number of traffic signs in a town starts at 135, after 5 months 175 traffic signs. a) What mathematical model represents this situation the best? Exponential or Linear? b) Create a Mathematical Model to describe this situation. c) How many signs will be in the town in 2 years?
can i get some help on this question please, thanks! The values below shows the number...
 can
i get some help on this question please, thanks!
The values below shows the number of new stores in a coffee shop chain that opened during the years 1986 through 1994. 1986, 14 1987, 27 1988, 48 1989, 80 1990, 110 1991, 153 1992, 261 1993, 403 1994, 681 Use your TI to create two lists L1 for year, L2 for number of new stores. Then create a third list L3 which takes Ln(L2) -- the natural log of...
can
i get some help on this question please, thanks!
The values below shows the number of new stores in a coffee shop chain that opened during the years 1986 through 1994. 1986, 14 1987, 27 1988, 48 1989, 80 1990, 110 1991, 153 1992, 261 1993, 403 1994, 681 Use your TI to create two lists L1 for year, L2 for number of new stores. Then create a third list L3 which takes Ln(L2) -- the natural log of...
QUESTION 10 The population of Kenosha in 2008 was 93,000 people. It has been growing at...
 QUESTION 10 The population of Kenosha in 2008 was 93,000 people. It has been growing at a rate of 2% each year. a) Create a mathematical model to represent this situation. b) If the trend continues, how long will it take for the population to reach 150,000?
MATH 123 HW 9 Exponential Modeling Name Due Section work in order to receive full credit. Your fr...
 MATH 123 HW 9 Exponential Modeling Name Due Section work in order to receive full credit. Your friend sends out a chain letter e-mail to 12 people by the next day 15 people have received the letter. Assuming an exponential growth pattern, what is the growth factor for the number chain letters received? Do not round 1. 2. Consider the data in the table. Round all answers to 2 decimal places Time ValueAbsolute Change Relative Change 13.60 14.85 16.10 17.35...
ONLY NEED H, I, J, K, L, M 1. (65 points: 5 points each) For each situation below, what is the most appropriate probability model for the random variable X? (no n a) Let X - how many customers will b...
 ONLY NEED H, I, J, K, L, M
1. (65 points: 5 points each) For each situation below, what is the most appropriate probability model for the random variable X? (no n a) Let X - how many customers will buy a sofa tomorrow at Wolf's furniture store. b) In a program that provides free home inspections for seniors, let X- how many homes eed to specify parameter values) are inspected before one needs a new roof. c) Let X...
ONLY NEED H, I, J, K, L, M
1. (65 points: 5 points each) For each situation below, what is the most appropriate probability model for the random variable X? (no n a) Let X - how many customers will buy a sofa tomorrow at Wolf's furniture store. b) In a program that provides free home inspections for seniors, let X- how many homes eed to specify parameter values) are inspected before one needs a new roof. c) Let X...
can somebody please help me with the question quickly I really need help with this, choose a country and research population data in order to fill out the table below.
 2. Choose a country and research population data in order to fill out the table beloa. Copy the population numbers counted each five years, as shown in the data base, for the years from 1950 to 2000 . Add a column, \(t\), measuring years șince 1945 .b. What is the country you selected? In what part of the world is it? What is the magnitude of its population numbers? \(\left(100,000^{\circ} \mathrm{s}\right.\), millions, hundred millions, billions?) Is it growing or shrinking...
Applications of Exponential Equations Many real-life situations can be modeled by an exponential ...
 ANSWER ALL PLEASE!
Applications of Exponential Equations Many real-life situations can be modeled by an exponential growth function of the form A(t) Ao ett constant that affects the rate of growth or decay, and t represents time. Using your knowledge of writing exponential equations that you did in the beginning of this chapter, what would A or an exponential decay function of the form A(t)-A ett where k represents the represent? 1. The amount of carbon-14 present in animal bones...
ANSWER ALL PLEASE!
Applications of Exponential Equations Many real-life situations can be modeled by an exponential growth function of the form A(t) Ao ett constant that affects the rate of growth or decay, and t represents time. Using your knowledge of writing exponential equations that you did in the beginning of this chapter, what would A or an exponential decay function of the form A(t)-A ett where k represents the represent? 1. The amount of carbon-14 present in animal bones...
A population numbers 14,000 organisms initially and grows by 8.8% each year. Suppose P represents population,...
 A population numbers 14,000 organisms initially and grows by 8.8% each year. Suppose P represents population, and t the number of years of growth. An exponential model for the population can be written in the form P = a.b' where P = If 24500 dollars is invested at an interest rate of 10 percent per year, find the value of the investment at the end of 5 years for the following compounding methods, to the nearest cent. (a) Annual: $...
This Question: 1 pt 8 of 167 completel Two homes are located 6 miles apart, each...
 This Question: 1 pt 8 of 167 completel Two homes are located 6 miles apart, each 1 mile from a road that patallels the ocean. Sally can jog 6 mph along the road, but only 4 mph in the sand. Because of a river between the two houses, it is necessary to jog on the sand to the road, continue on the road, and then jog on the sand to get from one house to the other. For 0° <O<90°,...
Use the Leading Coefficient Test to determine the end behavior of the graph of the given...
 Use the Leading Coefficient Test to determine the end behavior of the graph of the given polynomial function. f(x) = -6x* +5x2 - x +7 Choose the correct answer below. A. The graph of f(x) falls to the left and falls to the right. O B. The graph of f(x) falls to the left and rises to the right O C. The graph of f(x) rises to the left and rises to the right OD. The graph of f(x) rises...
 QUESTION 9 The number of traffic signs in a town starts at 135, after 5 months 175 traffic signs. a) What mathematical model represents this situation the best? Exponential or Linear? b) Create a Mathematical Model to describe this situation. c) How many signs will be in the town in 2 years?
 can
i get some help on this question please, thanks!
The values below shows the number of new stores in a coffee shop chain that opened during the years 1986 through 1994. 1986, 14 1987, 27 1988, 48 1989, 80 1990, 110 1991, 153 1992, 261 1993, 403 1994, 681 Use your TI to create two lists L1 for year, L2 for number of new stores. Then create a third list L3 which takes Ln(L2) -- the natural log of...
can
i get some help on this question please, thanks!
The values below shows the number of new stores in a coffee shop chain that opened during the years 1986 through 1994. 1986, 14 1987, 27 1988, 48 1989, 80 1990, 110 1991, 153 1992, 261 1993, 403 1994, 681 Use your TI to create two lists L1 for year, L2 for number of new stores. Then create a third list L3 which takes Ln(L2) -- the natural log of...
 QUESTION 10 The population of Kenosha in 2008 was 93,000 people. It has been growing at a rate of 2% each year. a) Create a mathematical model to represent this situation. b) If the trend continues, how long will it take for the population to reach 150,000?
 MATH 123 HW 9 Exponential Modeling Name Due Section work in order to receive full credit. Your friend sends out a chain letter e-mail to 12 people by the next day 15 people have received the letter. Assuming an exponential growth pattern, what is the growth factor for the number chain letters received? Do not round 1. 2. Consider the data in the table. Round all answers to 2 decimal places Time ValueAbsolute Change Relative Change 13.60 14.85 16.10 17.35...
 ONLY NEED H, I, J, K, L, M
1. (65 points: 5 points each) For each situation below, what is the most appropriate probability model for the random variable X? (no n a) Let X - how many customers will buy a sofa tomorrow at Wolf's furniture store. b) In a program that provides free home inspections for seniors, let X- how many homes eed to specify parameter values) are inspected before one needs a new roof. c) Let X...
ONLY NEED H, I, J, K, L, M
1. (65 points: 5 points each) For each situation below, what is the most appropriate probability model for the random variable X? (no n a) Let X - how many customers will buy a sofa tomorrow at Wolf's furniture store. b) In a program that provides free home inspections for seniors, let X- how many homes eed to specify parameter values) are inspected before one needs a new roof. c) Let X...
 ANSWER ALL PLEASE!
Applications of Exponential Equations Many real-life situations can be modeled by an exponential growth function of the form A(t) Ao ett constant that affects the rate of growth or decay, and t represents time. Using your knowledge of writing exponential equations that you did in the beginning of this chapter, what would A or an exponential decay function of the form A(t)-A ett where k represents the represent? 1. The amount of carbon-14 present in animal bones...
ANSWER ALL PLEASE!
Applications of Exponential Equations Many real-life situations can be modeled by an exponential growth function of the form A(t) Ao ett constant that affects the rate of growth or decay, and t represents time. Using your knowledge of writing exponential equations that you did in the beginning of this chapter, what would A or an exponential decay function of the form A(t)-A ett where k represents the represent? 1. The amount of carbon-14 present in animal bones...
 A population numbers 14,000 organisms initially and grows by 8.8% each year. Suppose P represents population, and t the number of years of growth. An exponential model for the population can be written in the form P = a.b' where P = If 24500 dollars is invested at an interest rate of 10 percent per year, find the value of the investment at the end of 5 years for the following compounding methods, to the nearest cent. (a) Annual: $...
 This Question: 1 pt 8 of 167 completel Two homes are located 6 miles apart, each 1 mile from a road that patallels the ocean. Sally can jog 6 mph along the road, but only 4 mph in the sand. Because of a river between the two houses, it is necessary to jog on the sand to the road, continue on the road, and then jog on the sand to get from one house to the other. For 0° <O<90°,...
 Use the Leading Coefficient Test to determine the end behavior of the graph of the given polynomial function. f(x) = -6x* +5x2 - x +7 Choose the correct answer below. A. The graph of f(x) falls to the left and falls to the right. O B. The graph of f(x) falls to the left and rises to the right O C. The graph of f(x) rises to the left and rises to the right OD. The graph of f(x) rises...
Most questions answered within 3 hours.
-
Language: Python
Function name : findwaldo
Parameters : string
Returns: int
Description: Write a recursive function...
asked 15 minutes ago -
1) A loan of RM 10,000 at a flat rate of 10% per annum was
repaid...
asked 22 minutes ago -
Suppose you have been following a particular airline stock for
many years. You are interested in...
asked 28 minutes ago -
Describe the organic pasta: Is it a normal/inferior
good? Is it a necessity/luxury? Does it have...
asked 30 minutes ago -
Are Republicans just as likely as Democrats to display the
American flag in front of their...
asked 39 minutes ago -
Select the true statement below.
nitrogen dioxide is a stronger potential oxidizing agent than
dinitrogen monoxide...
asked 43 minutes ago -
What’s the probability of getting a sequence of 1,2,3,4,5,6 if
we roll a dice six times?
asked 44 minutes ago -
Ibarra Corporation uses the FIFO method in its process costing
system. The first processing department, the...
asked 45 minutes ago -
Multiple Choice Question:
Jennifer Jones, a 38-year-old employee at a metal fabricating
plant, was injured in...
asked 49 minutes ago -
Assume that adults have IQ scores that are normally distributed
with a mean of µ =105...
asked 1 hour ago -
Self-Study Problem 12.3
Part a:
Linda filed her tax return 2 months late. The tax paid...
asked 1 hour ago -
1. How many MOLECULES of
boron trichloride are present in
8.03 grams of this compound ?...
asked 1 hour ago