

Homework Answers

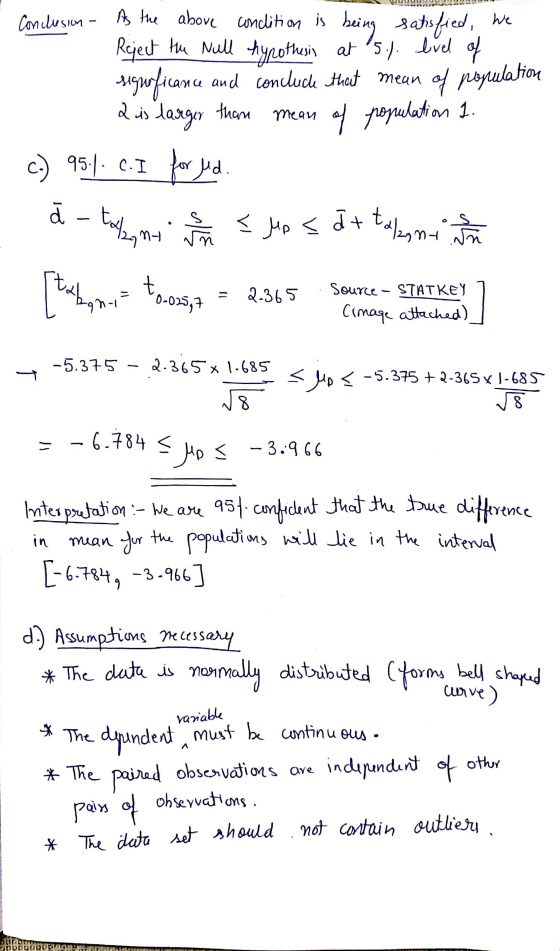


The test statistic is calculated using the formula mentioned. The critical value is obtained from STATKEY (image attached for reference). We compare the test statistic with critical value and make the required conclusion. The 95% C.I is constructed as shown.
Add Answer to:
parts A-D please and thx
The data for a random sample of 8 paired observations are...
The data for a random sample of 8 paired observations are shown in the table to...
 The data for a random sample of 8 paired observations are shown in the table to the right. Pair Population 1 53 37 24 Population 2 58 39 25 61 53 38 38 39 a. What are the appropriate null and alternative hypotheses to test whether the mean for population 2 is larger than that for population 1? b. Conduct the test identified in part a using α 0.01 c. Find a 99% confidence interval for μd. Interpret this result....
b. A. t > __ B. |t| > ___ C. t < __ d: A) The...
 b.
A. t > __
B. |t| > ___
C. t < __
d:
A) The variances of the two populations are
approximately the same.
B) The population of differences is approximately
normal
C) The populations being sampled are approximately
normal
D) No assumptions are required
Pair Population 1 60 Population 2 63 1 2. 24 25 3 53 55 The data for a random sample of 8 paired observations are shown in the table to the right. a. What...
b.
A. t > __
B. |t| > ___
C. t < __
d:
A) The variances of the two populations are
approximately the same.
B) The population of differences is approximately
normal
C) The populations being sampled are approximately
normal
D) No assumptions are required
Pair Population 1 60 Population 2 63 1 2. 24 25 3 53 55 The data for a random sample of 8 paired observations are shown in the table to the right. a. What...
Also Calculate the test statistic Also calculate the Confidence interval STA2023-20Summer B001 Vincent Smith & 07/29/20...
 Also Calculate the test statistic
Also calculate the Confidence interval
STA2023-20Summer B001 Vincent Smith & 07/29/20 8:04 PM Homework: Chapter9 Save Score: 0 of 5 pts 1 3 of 3 (2 complete) HW Score: 50%, 7.5 of 15 pts 9.3.38 Question Help Pair 1 2 The data for a random sample of 8 paired observations are shown in the table to the right. a. What are the appropriate null and alternative hypotheses to test whether the mean for population 2...
Also Calculate the test statistic
Also calculate the Confidence interval
STA2023-20Summer B001 Vincent Smith & 07/29/20 8:04 PM Homework: Chapter9 Save Score: 0 of 5 pts 1 3 of 3 (2 complete) HW Score: 50%, 7.5 of 15 pts 9.3.38 Question Help Pair 1 2 The data for a random sample of 8 paired observations are shown in the table to the right. a. What are the appropriate null and alternative hypotheses to test whether the mean for population 2...
The data for a random sample of six paired observations are shown in the table a....
 The data for a random sample of six paired observations are shown in the table a. Calculate and b. Express in terms of , and a c. Forma 99% confidence interval for d. Test the null hypothesis against the native hypothesis Us 0.01 Calculate the difference between each pair of observations by racing bein tromber (Round to two decimal places as needed) Calculates (Round to two decimal places as needed.) The data for a random sample of six paired observations...
The following hypotheses are given. He:p20 Hip<0 A random sample of 15 paired observations has a...
 The following hypotheses are given. He:p20 Hip<0 A random sample of 15 paired observations has a correlation of - 46. Can we conclude that the correlation in the population is less than zero? Use the 05 significance level. 1. State the decision rule for 0.05 significance level. (Negative amount should be indicated by a minus sign. Round your answer to 3 decimal places.) Reject HO ift 2. Compute the value of the test statistic. (Negative amount should be indicated by...
9.6 in order to compare the means of two populations, inde- NW pendent random samples of 400 observations are selected from each population, with the following results Sample 1 Sample 2 $.240 s2 200...
 9.6 in order to compare the means of two populations, inde- NW pendent random samples of 400 observations are selected from each population, with the following results Sample 1 Sample 2 $.240 s2 200 5,275 1150 a. Use a 95% confidence interval to estimate the dif- ference between the population means (μ,-μ Interpret the confidence interval. b. Test the null hypothesis Ho (μι-μ)--0 versus the c. Suppose the test in part b were conducted with the d. Test thenull hypothesis...
in order to compare the means of two populations, independent random samples of 400 observations are...
in order to compare the means of two populations, independent random samples of 400 observations are selected from each population with the results: sample 1: x1= 5275 and s1= 150 sample 2: x2= 5240 and s2 = 200 a. use a 95% confidence interval to estimate the difference between the population means (m1-m2) interpret the difference. b. test the null hypothesis (m1-m2 = 0) versus the alternative (m1-m2 isn't = to 0). give the p-value of the test and interpret...
In order to compare the means of two populations, independent random samples of 385 observations are...
In order to compare the means of two populations, independent random samples of 385 observations are selected from each population, with the results found in the table to the right. Complete parts a through e. Sample 1 Sample 2 X1 = 5,337 X2 = 5,298 s1 = 157 s2 = 191 a. use a 95% confidence interval to estimate the difference between the population means (u1 - u2). Interpret the confidence interval. b. test the null hypothesis H0: (u1 - u2)...
Res Exercise 10-24 Algo A sample of 39 paired observations generates the following data d 2.5...
 Res Exercise 10-24 Algo A sample of 39 paired observations generates the following data d 2.5 and useful to reference the appropriate table: z table or t table 50. Assume a normal distribution. (You may find it a. Construct the 90% confidence interval for the mean difference HD (Round intermediate calculations to at least 4 decimal places and final answers to 2 decimal places.) Answer is complete but not entirely correct. 115 to 384 Confidence interval is 01 b. Using...
Exercise 10-24 Algo A sample of 39 paired observations generates the following data: d= 25 and...
 Exercise 10-24 Algo A sample of 39 paired observations generates the following data: d= 25 and s,,-5 useful to reference the appropriate table: z table or tt observations generates the following data: d -25 and s) -5.0. Assume a normal distribution. (You may find it e interval for the mean difference Ho (Round intermediate calculations to et leaest 4 decimal places and final answers to 2 decimal places.) Confidence interval is 3.84 b. Using the confidence interval, test whether the...
 The data for a random sample of 8 paired observations are shown in the table to the right. Pair Population 1 53 37 24 Population 2 58 39 25 61 53 38 38 39 a. What are the appropriate null and alternative hypotheses to test whether the mean for population 2 is larger than that for population 1? b. Conduct the test identified in part a using α 0.01 c. Find a 99% confidence interval for μd. Interpret this result....
 b.
A. t > __
B. |t| > ___
C. t < __
d:
A) The variances of the two populations are
approximately the same.
B) The population of differences is approximately
normal
C) The populations being sampled are approximately
normal
D) No assumptions are required
Pair Population 1 60 Population 2 63 1 2. 24 25 3 53 55 The data for a random sample of 8 paired observations are shown in the table to the right. a. What...
b.
A. t > __
B. |t| > ___
C. t < __
d:
A) The variances of the two populations are
approximately the same.
B) The population of differences is approximately
normal
C) The populations being sampled are approximately
normal
D) No assumptions are required
Pair Population 1 60 Population 2 63 1 2. 24 25 3 53 55 The data for a random sample of 8 paired observations are shown in the table to the right. a. What...
 Also Calculate the test statistic
Also calculate the Confidence interval
STA2023-20Summer B001 Vincent Smith & 07/29/20 8:04 PM Homework: Chapter9 Save Score: 0 of 5 pts 1 3 of 3 (2 complete) HW Score: 50%, 7.5 of 15 pts 9.3.38 Question Help Pair 1 2 The data for a random sample of 8 paired observations are shown in the table to the right. a. What are the appropriate null and alternative hypotheses to test whether the mean for population 2...
Also Calculate the test statistic
Also calculate the Confidence interval
STA2023-20Summer B001 Vincent Smith & 07/29/20 8:04 PM Homework: Chapter9 Save Score: 0 of 5 pts 1 3 of 3 (2 complete) HW Score: 50%, 7.5 of 15 pts 9.3.38 Question Help Pair 1 2 The data for a random sample of 8 paired observations are shown in the table to the right. a. What are the appropriate null and alternative hypotheses to test whether the mean for population 2...
 The data for a random sample of six paired observations are shown in the table a. Calculate and b. Express in terms of , and a c. Forma 99% confidence interval for d. Test the null hypothesis against the native hypothesis Us 0.01 Calculate the difference between each pair of observations by racing bein tromber (Round to two decimal places as needed) Calculates (Round to two decimal places as needed.) The data for a random sample of six paired observations...
 The following hypotheses are given. He:p20 Hip<0 A random sample of 15 paired observations has a correlation of - 46. Can we conclude that the correlation in the population is less than zero? Use the 05 significance level. 1. State the decision rule for 0.05 significance level. (Negative amount should be indicated by a minus sign. Round your answer to 3 decimal places.) Reject HO ift 2. Compute the value of the test statistic. (Negative amount should be indicated by...
 9.6 in order to compare the means of two populations, inde- NW pendent random samples of 400 observations are selected from each population, with the following results Sample 1 Sample 2 $.240 s2 200 5,275 1150 a. Use a 95% confidence interval to estimate the dif- ference between the population means (μ,-μ Interpret the confidence interval. b. Test the null hypothesis Ho (μι-μ)--0 versus the c. Suppose the test in part b were conducted with the d. Test thenull hypothesis...
 Res Exercise 10-24 Algo A sample of 39 paired observations generates the following data d 2.5 and useful to reference the appropriate table: z table or t table 50. Assume a normal distribution. (You may find it a. Construct the 90% confidence interval for the mean difference HD (Round intermediate calculations to at least 4 decimal places and final answers to 2 decimal places.) Answer is complete but not entirely correct. 115 to 384 Confidence interval is 01 b. Using...
 Exercise 10-24 Algo A sample of 39 paired observations generates the following data: d= 25 and s,,-5 useful to reference the appropriate table: z table or tt observations generates the following data: d -25 and s) -5.0. Assume a normal distribution. (You may find it e interval for the mean difference Ho (Round intermediate calculations to et leaest 4 decimal places and final answers to 2 decimal places.) Confidence interval is 3.84 b. Using the confidence interval, test whether the...
Most questions answered within 3 hours.
-
Angel Corporation has $10,000,000 of
8.0% 25 year bonds dated May 1, 2018 with interest payable...
asked 17 minutes ago -
7.
________ involves individuals trading goods they already have or
providing services in exchange for something...
asked 21 minutes ago -
Share your research problem. What databases did you search as
you gathered evidence to support your...
asked 21 minutes ago -
what process occurs to form microspores and megaspores in flowering
plants?
asked 29 minutes ago -
C++
I need to use the function getData to put in all my data using
arrays....
asked 28 minutes ago -
A block is hung by a string from the inside roof of a van. When
the...
asked 35 minutes ago -
Do you think companies should not go for long term debt in their
capital structure to...
asked 44 minutes ago -
I create an address book where the user enters the name, phone
and email in the...
asked 50 minutes ago -
The production capacity for acrylonitrile
(C3H3N) in the United States exceeds 2
million pounds per year....
asked 57 minutes ago -
explain and comment out your answer
43. How many address lines are required to address a...
asked 1 hour ago -
A sample of 45 observations is selected from a normal
population. The sample mean is 49,...
asked 1 hour ago -
A construction company is planning to bid on a building
contract. The bid costs the company...
asked 1 hour ago