
b.
A. t > __
B. |t| > ___
C. t < __
d:
A) The variances of the two populations are approximately the same.
B) The population of differences is approximately normal
C) The populations being sampled are approximately normal
D) No assumptions are required
Homework Answers
![S = 1-1 [74 6-2027 8-12 8 Is = 1 1/2 [74 400 ] = [74-50] IS Ix24 7 13.4286 is 1.852 Now, -2.5 0.6548 t = da -2.5 s/n 1.852718](http://img.homeworklib.com/questions/485420e0-0f15-11eb-aa07-f57e11b53bc7.png?x-oss-process=image/resize,w_560)


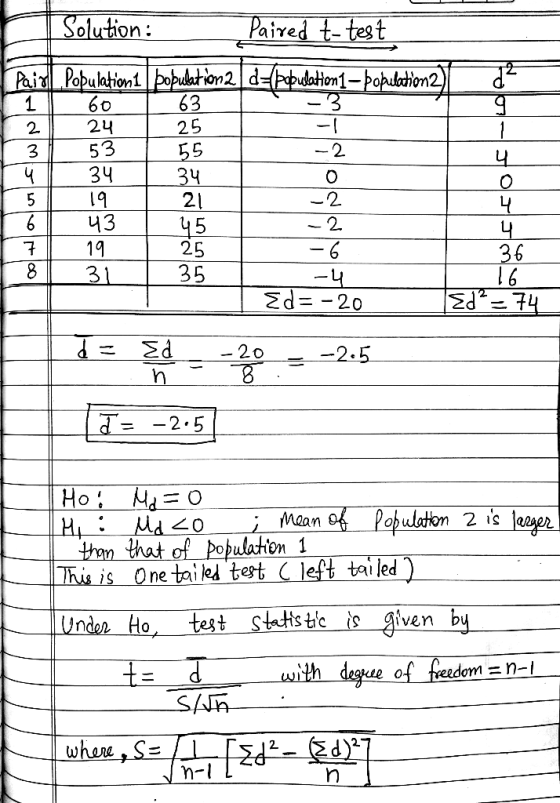
The data for a random sample of 8 paired observations are shown in the table to...
 The data for a random sample of 8 paired observations are shown in the table to the right. Pair Population 1 53 37 24 Population 2 58 39 25 61 53 38 38 39 a. What are the appropriate null and alternative hypotheses to test whether the mean for population 2 is larger than that for population 1? b. Conduct the test identified in part a using α 0.01 c. Find a 99% confidence interval for μd. Interpret this result....
parts A-D please and thx The data for a random sample of 8 paired observations are...
 parts A-D please and thx
The data for a random sample of 8 paired observations are shown in the table to the right. a. What are the appropriate null and alternative hypotheses to test whether the mean for population 2 is larger than that for population 1? b. Conduct the test identified in part a using a= 0.05. c. Find a 95% confidence interval for Interpret this result. d. What assumptions are necessary to ensure the validity of this analysis?...
parts A-D please and thx
The data for a random sample of 8 paired observations are shown in the table to the right. a. What are the appropriate null and alternative hypotheses to test whether the mean for population 2 is larger than that for population 1? b. Conduct the test identified in part a using a= 0.05. c. Find a 95% confidence interval for Interpret this result. d. What assumptions are necessary to ensure the validity of this analysis?...
Also Calculate the test statistic Also calculate the Confidence interval STA2023-20Summer B001 Vincent Smith & 07/29/20...
 Also Calculate the test statistic
Also calculate the Confidence interval
STA2023-20Summer B001 Vincent Smith & 07/29/20 8:04 PM Homework: Chapter9 Save Score: 0 of 5 pts 1 3 of 3 (2 complete) HW Score: 50%, 7.5 of 15 pts 9.3.38 Question Help Pair 1 2 The data for a random sample of 8 paired observations are shown in the table to the right. a. What are the appropriate null and alternative hypotheses to test whether the mean for population 2...
Also Calculate the test statistic
Also calculate the Confidence interval
STA2023-20Summer B001 Vincent Smith & 07/29/20 8:04 PM Homework: Chapter9 Save Score: 0 of 5 pts 1 3 of 3 (2 complete) HW Score: 50%, 7.5 of 15 pts 9.3.38 Question Help Pair 1 2 The data for a random sample of 8 paired observations are shown in the table to the right. a. What are the appropriate null and alternative hypotheses to test whether the mean for population 2...
section 10.4 The nul hypothesis is Hoi Hy Hy and the alternative hypothesis is H: *...
 section 10.4
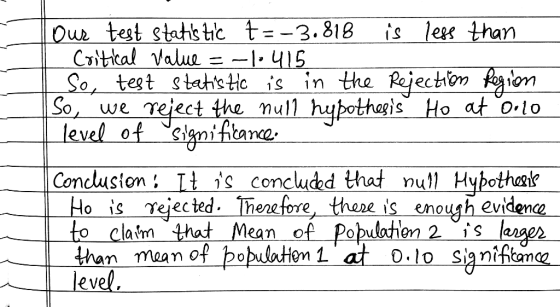
The nul hypothesis is Hoi Hy Hy and the alternative hypothesis is H: * Hz. The data in the accompanying table are from a simple random paired sample from the two populations under consideration. Use the paired t-test to perform the required hypothesis test at the 10% significance level Click the icon to view the data table. Click the icon to view the table of critical values. Find the test statistic. Use population 1 - population 2 as...
section 10.4
The nul hypothesis is Hoi Hy Hy and the alternative hypothesis is H: * Hz. The data in the accompanying table are from a simple random paired sample from the two populations under consideration. Use the paired t-test to perform the required hypothesis test at the 10% significance level Click the icon to view the data table. Click the icon to view the table of critical values. Find the test statistic. Use population 1 - population 2 as...
9.6 in order to compare the means of two populations, inde- NW pendent random samples of 400 observations are selected from each population, with the following results Sample 1 Sample 2 $.240 s2 200...
 9.6 in order to compare the means of two populations, inde- NW pendent random samples of 400 observations are selected from each population, with the following results Sample 1 Sample 2 $.240 s2 200 5,275 1150 a. Use a 95% confidence interval to estimate the dif- ference between the population means (μ,-μ Interpret the confidence interval. b. Test the null hypothesis Ho (μι-μ)--0 versus the c. Suppose the test in part b were conducted with the d. Test thenull hypothesis...
1. When do we use an independent groups t-test? a. b. c. d. When we are...
 1. When do we use an independent groups t-test? a. b. c. d. When we are comparing means from one sample that has been measured twice. When we are comparing means from two different samples. When we are comparing a sample mean to a population mean. When we are comparing two population means. 2. Which of the following is true regarding the use of t-tests for true experiments versus quasi-experimental designs? a. b. We use the same t-test whether it...
Please help with the following multiple choice 1. In the one-way ANOVA where there are k...
Please help with the following multiple choice 1. In the one-way ANOVA where there are k treatments and n observations, the degrees of freedom for the F-statistic are equal to, respectively: a. n and k. b. k and n. c. n − k and k − 1. d. k − 1 and n − k. 2. In ANOVA, the F-test is the ratio of two sample variances. In the one-way ANOVA (completely randomized design), the variance used as a numerator...
in order to compare the means of two populations, independent random samples of 400 observations are...
in order to compare the means of two populations, independent random samples of 400 observations are selected from each population with the results: sample 1: x1= 5275 and s1= 150 sample 2: x2= 5240 and s2 = 200 a. use a 95% confidence interval to estimate the difference between the population means (m1-m2) interpret the difference. b. test the null hypothesis (m1-m2 = 0) versus the alternative (m1-m2 isn't = to 0). give the p-value of the test and interpret...
True or false? When the population variances are known, the test statistic that we use to...
True or false? When the population variances are known, the test statistic that we use to compare two population means using two independent samples follows the standard normal distribution. True or false? A paired t-test with two columns of 8 observations in each column should use d.f =7
A randomized block design yielded the ANOVA table to the right. Complete parts a through g....
 A randomized block design yielded the ANOVA table to the right. Complete parts a through g. Source Treatments Blocks Error Total df 5 2 10 17 SS 504 276 120 900 MS 100.8 138.0 12.0 F 8.400 11.500 a. How many blocks and treatments were used in the experiment? There were There were blocks and treatments used. b. How many observations were collected in the experiment? n=0 c. Specify the null and alternative hypotheses you would use to compare the...
 The data for a random sample of 8 paired observations are shown in the table to the right. Pair Population 1 53 37 24 Population 2 58 39 25 61 53 38 38 39 a. What are the appropriate null and alternative hypotheses to test whether the mean for population 2 is larger than that for population 1? b. Conduct the test identified in part a using α 0.01 c. Find a 99% confidence interval for μd. Interpret this result....
 parts A-D please and thx
The data for a random sample of 8 paired observations are shown in the table to the right. a. What are the appropriate null and alternative hypotheses to test whether the mean for population 2 is larger than that for population 1? b. Conduct the test identified in part a using a= 0.05. c. Find a 95% confidence interval for Interpret this result. d. What assumptions are necessary to ensure the validity of this analysis?...
parts A-D please and thx
The data for a random sample of 8 paired observations are shown in the table to the right. a. What are the appropriate null and alternative hypotheses to test whether the mean for population 2 is larger than that for population 1? b. Conduct the test identified in part a using a= 0.05. c. Find a 95% confidence interval for Interpret this result. d. What assumptions are necessary to ensure the validity of this analysis?...
 Also Calculate the test statistic
Also calculate the Confidence interval
STA2023-20Summer B001 Vincent Smith & 07/29/20 8:04 PM Homework: Chapter9 Save Score: 0 of 5 pts 1 3 of 3 (2 complete) HW Score: 50%, 7.5 of 15 pts 9.3.38 Question Help Pair 1 2 The data for a random sample of 8 paired observations are shown in the table to the right. a. What are the appropriate null and alternative hypotheses to test whether the mean for population 2...
Also Calculate the test statistic
Also calculate the Confidence interval
STA2023-20Summer B001 Vincent Smith & 07/29/20 8:04 PM Homework: Chapter9 Save Score: 0 of 5 pts 1 3 of 3 (2 complete) HW Score: 50%, 7.5 of 15 pts 9.3.38 Question Help Pair 1 2 The data for a random sample of 8 paired observations are shown in the table to the right. a. What are the appropriate null and alternative hypotheses to test whether the mean for population 2...
 section 10.4
The nul hypothesis is Hoi Hy Hy and the alternative hypothesis is H: * Hz. The data in the accompanying table are from a simple random paired sample from the two populations under consideration. Use the paired t-test to perform the required hypothesis test at the 10% significance level Click the icon to view the data table. Click the icon to view the table of critical values. Find the test statistic. Use population 1 - population 2 as...
section 10.4
The nul hypothesis is Hoi Hy Hy and the alternative hypothesis is H: * Hz. The data in the accompanying table are from a simple random paired sample from the two populations under consideration. Use the paired t-test to perform the required hypothesis test at the 10% significance level Click the icon to view the data table. Click the icon to view the table of critical values. Find the test statistic. Use population 1 - population 2 as...
 9.6 in order to compare the means of two populations, inde- NW pendent random samples of 400 observations are selected from each population, with the following results Sample 1 Sample 2 $.240 s2 200 5,275 1150 a. Use a 95% confidence interval to estimate the dif- ference between the population means (μ,-μ Interpret the confidence interval. b. Test the null hypothesis Ho (μι-μ)--0 versus the c. Suppose the test in part b were conducted with the d. Test thenull hypothesis...
 1. When do we use an independent groups t-test? a. b. c. d. When we are comparing means from one sample that has been measured twice. When we are comparing means from two different samples. When we are comparing a sample mean to a population mean. When we are comparing two population means. 2. Which of the following is true regarding the use of t-tests for true experiments versus quasi-experimental designs? a. b. We use the same t-test whether it...
 A randomized block design yielded the ANOVA table to the right. Complete parts a through g. Source Treatments Blocks Error Total df 5 2 10 17 SS 504 276 120 900 MS 100.8 138.0 12.0 F 8.400 11.500 a. How many blocks and treatments were used in the experiment? There were There were blocks and treatments used. b. How many observations were collected in the experiment? n=0 c. Specify the null and alternative hypotheses you would use to compare the...
Most questions answered within 3 hours.
-
1) Who is a Hispanic consumer?
2) Who is a Latin consumer?
3) Are Hispanic and...
asked 1 minute from now -
Rod figures that it takes an average (mean) of =20 minutes with
a standard deviation of...
asked 16 minutes ago -
You have 5 ul of a pure (undiluted) culture at a concentration
of 3.6 x 10⁶...
asked 21 minutes ago -
______ activity indicates the presence of an electron transport
chain.
1- gelatinase 2- oxidase 3- caseinase...
asked 23 minutes ago -
The molarity of a silver nitrate solution is 0.192 M. How many
grams of silver ions...
asked 37 minutes ago -
Which of the following solutes will produce a greater increase
in boiling point when it is...
asked 32 minutes ago -
true or false: Series connected electrical circuit is a voltage
divider, and voltage of each device...
asked 27 minutes ago -
A 100-W lightbulb has a resistance of about 12 Ω when cold (20
∘C) and 128...
asked 31 minutes ago -
For the asset shown in the following table, use the capital
asset pricing model to find...
asked 32 minutes ago -
If the impulse response of a circuit is a pulse y(t) = u(t) –
u(t-T), T...
asked 39 minutes ago -
Eukaryotic cells have __ which is similar to prokaryotes of
Archaea.
A Ester-linked membrane lipids
B...
asked 48 minutes ago -
true or false. If work is done on a system by it's
surroundings, its value is...
asked 53 minutes ago