
Homework Answers


Add Answer to:
The data for a random sample of 8 paired observations are shown in the table to...
parts A-D please and thx The data for a random sample of 8 paired observations are...
 parts A-D please and thx
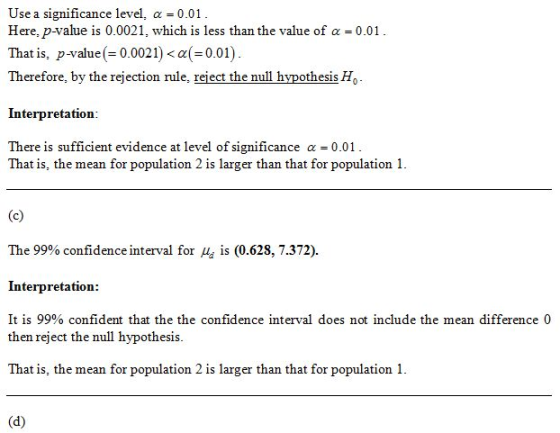
The data for a random sample of 8 paired observations are shown in the table to the right. a. What are the appropriate null and alternative hypotheses to test whether the mean for population 2 is larger than that for population 1? b. Conduct the test identified in part a using a= 0.05. c. Find a 95% confidence interval for Interpret this result. d. What assumptions are necessary to ensure the validity of this analysis?...
parts A-D please and thx
The data for a random sample of 8 paired observations are shown in the table to the right. a. What are the appropriate null and alternative hypotheses to test whether the mean for population 2 is larger than that for population 1? b. Conduct the test identified in part a using a= 0.05. c. Find a 95% confidence interval for Interpret this result. d. What assumptions are necessary to ensure the validity of this analysis?...
The data for a random sample of six paired observations are shown in the table a....
 The data for a random sample of six paired observations are shown in the table a. Calculate and b. Express in terms of , and a c. Forma 99% confidence interval for d. Test the null hypothesis against the native hypothesis Us 0.01 Calculate the difference between each pair of observations by racing bein tromber (Round to two decimal places as needed) Calculates (Round to two decimal places as needed.) The data for a random sample of six paired observations...
b. A. t > __ B. |t| > ___ C. t < __ d: A) The...
 b.
A. t > __
B. |t| > ___
C. t < __
d:
A) The variances of the two populations are
approximately the same.
B) The population of differences is approximately
normal
C) The populations being sampled are approximately
normal
D) No assumptions are required
Pair Population 1 60 Population 2 63 1 2. 24 25 3 53 55 The data for a random sample of 8 paired observations are shown in the table to the right. a. What...
b.
A. t > __
B. |t| > ___
C. t < __
d:
A) The variances of the two populations are
approximately the same.
B) The population of differences is approximately
normal
C) The populations being sampled are approximately
normal
D) No assumptions are required
Pair Population 1 60 Population 2 63 1 2. 24 25 3 53 55 The data for a random sample of 8 paired observations are shown in the table to the right. a. What...
Also Calculate the test statistic Also calculate the Confidence interval STA2023-20Summer B001 Vincent Smith & 07/29/20...
 Also Calculate the test statistic
Also calculate the Confidence interval
STA2023-20Summer B001 Vincent Smith & 07/29/20 8:04 PM Homework: Chapter9 Save Score: 0 of 5 pts 1 3 of 3 (2 complete) HW Score: 50%, 7.5 of 15 pts 9.3.38 Question Help Pair 1 2 The data for a random sample of 8 paired observations are shown in the table to the right. a. What are the appropriate null and alternative hypotheses to test whether the mean for population 2...
Also Calculate the test statistic
Also calculate the Confidence interval
STA2023-20Summer B001 Vincent Smith & 07/29/20 8:04 PM Homework: Chapter9 Save Score: 0 of 5 pts 1 3 of 3 (2 complete) HW Score: 50%, 7.5 of 15 pts 9.3.38 Question Help Pair 1 2 The data for a random sample of 8 paired observations are shown in the table to the right. a. What are the appropriate null and alternative hypotheses to test whether the mean for population 2...
The following hypotheses are given. He:p20 Hip<0 A random sample of 15 paired observations has a...
 The following hypotheses are given. He:p20 Hip<0 A random sample of 15 paired observations has a correlation of - 46. Can we conclude that the correlation in the population is less than zero? Use the 05 significance level. 1. State the decision rule for 0.05 significance level. (Negative amount should be indicated by a minus sign. Round your answer to 3 decimal places.) Reject HO ift 2. Compute the value of the test statistic. (Negative amount should be indicated by...
Suppose you want to test the claim the the paired sample data given below come from...
Suppose you want to test the claim the the paired sample data given below come from a population for which the mean difference is μd=0. xy7866678183687180529154928286 Use a 0.01 significance level to find the following: (a) The mean value of the differnces d for the paired sample data d¯= (b) The standard deviation of the differences d for the paired sample data sd= (c) The t test statistic t= (d) The positive critical value t= (e) The negative critical value...
A sample of 26 paired observations generates the following data: d−d− = 1.0 and s2DsD2 =...
A sample of 26 paired observations generates the following data: d−d− = 1.0 and s2DsD2 = 3.4. Assume a normal distribution. (You may find it useful to reference the appropriate table: z table or t table) a. Construct the 99% confidence interval for the mean difference μD. (Round intermediate calculations to at least 4 decimal places and final answers to 2 decimal places.) Confidence interval is to
A paired difference experiment produced the following data: nD = 18 x1 = 92 &nbs
A paired difference experiment produced the following data: nD = 18 x1 = 92 x2 = 95.5 xD = -3.5 sD2 = 21 Determine the values of t for which the null hypothesis, µ1 - µ2 = 0, would be rejected in favor of the alternative hypotheses, µ1 - µ2 < 0. Use α = .10. Conduct the paired difference test described in part a. Draw the appropriate conclusions. What assumptions are necessary so that the paired difference test...
9.6 in order to compare the means of two populations, inde- NW pendent random samples of 400 observations are selected from each population, with the following results Sample 1 Sample 2 $.240 s2 200...
 9.6 in order to compare the means of two populations, inde- NW pendent random samples of 400 observations are selected from each population, with the following results Sample 1 Sample 2 $.240 s2 200 5,275 1150 a. Use a 95% confidence interval to estimate the dif- ference between the population means (μ,-μ Interpret the confidence interval. b. Test the null hypothesis Ho (μι-μ)--0 versus the c. Suppose the test in part b were conducted with the d. Test thenull hypothesis...
in order to compare the means of two populations, independent random samples of 400 observations are...
in order to compare the means of two populations, independent random samples of 400 observations are selected from each population with the results: sample 1: x1= 5275 and s1= 150 sample 2: x2= 5240 and s2 = 200 a. use a 95% confidence interval to estimate the difference between the population means (m1-m2) interpret the difference. b. test the null hypothesis (m1-m2 = 0) versus the alternative (m1-m2 isn't = to 0). give the p-value of the test and interpret...
 parts A-D please and thx
The data for a random sample of 8 paired observations are shown in the table to the right. a. What are the appropriate null and alternative hypotheses to test whether the mean for population 2 is larger than that for population 1? b. Conduct the test identified in part a using a= 0.05. c. Find a 95% confidence interval for Interpret this result. d. What assumptions are necessary to ensure the validity of this analysis?...
parts A-D please and thx
The data for a random sample of 8 paired observations are shown in the table to the right. a. What are the appropriate null and alternative hypotheses to test whether the mean for population 2 is larger than that for population 1? b. Conduct the test identified in part a using a= 0.05. c. Find a 95% confidence interval for Interpret this result. d. What assumptions are necessary to ensure the validity of this analysis?...
 The data for a random sample of six paired observations are shown in the table a. Calculate and b. Express in terms of , and a c. Forma 99% confidence interval for d. Test the null hypothesis against the native hypothesis Us 0.01 Calculate the difference between each pair of observations by racing bein tromber (Round to two decimal places as needed) Calculates (Round to two decimal places as needed.) The data for a random sample of six paired observations...
 b.
A. t > __
B. |t| > ___
C. t < __
d:
A) The variances of the two populations are
approximately the same.
B) The population of differences is approximately
normal
C) The populations being sampled are approximately
normal
D) No assumptions are required
Pair Population 1 60 Population 2 63 1 2. 24 25 3 53 55 The data for a random sample of 8 paired observations are shown in the table to the right. a. What...
b.
A. t > __
B. |t| > ___
C. t < __
d:
A) The variances of the two populations are
approximately the same.
B) The population of differences is approximately
normal
C) The populations being sampled are approximately
normal
D) No assumptions are required
Pair Population 1 60 Population 2 63 1 2. 24 25 3 53 55 The data for a random sample of 8 paired observations are shown in the table to the right. a. What...
 Also Calculate the test statistic
Also calculate the Confidence interval
STA2023-20Summer B001 Vincent Smith & 07/29/20 8:04 PM Homework: Chapter9 Save Score: 0 of 5 pts 1 3 of 3 (2 complete) HW Score: 50%, 7.5 of 15 pts 9.3.38 Question Help Pair 1 2 The data for a random sample of 8 paired observations are shown in the table to the right. a. What are the appropriate null and alternative hypotheses to test whether the mean for population 2...
Also Calculate the test statistic
Also calculate the Confidence interval
STA2023-20Summer B001 Vincent Smith & 07/29/20 8:04 PM Homework: Chapter9 Save Score: 0 of 5 pts 1 3 of 3 (2 complete) HW Score: 50%, 7.5 of 15 pts 9.3.38 Question Help Pair 1 2 The data for a random sample of 8 paired observations are shown in the table to the right. a. What are the appropriate null and alternative hypotheses to test whether the mean for population 2...
 The following hypotheses are given. He:p20 Hip<0 A random sample of 15 paired observations has a correlation of - 46. Can we conclude that the correlation in the population is less than zero? Use the 05 significance level. 1. State the decision rule for 0.05 significance level. (Negative amount should be indicated by a minus sign. Round your answer to 3 decimal places.) Reject HO ift 2. Compute the value of the test statistic. (Negative amount should be indicated by...
 9.6 in order to compare the means of two populations, inde- NW pendent random samples of 400 observations are selected from each population, with the following results Sample 1 Sample 2 $.240 s2 200 5,275 1150 a. Use a 95% confidence interval to estimate the dif- ference between the population means (μ,-μ Interpret the confidence interval. b. Test the null hypothesis Ho (μι-μ)--0 versus the c. Suppose the test in part b were conducted with the d. Test thenull hypothesis...
Most questions answered within 3 hours.
-
Create a balanced compensation plan that you feel would
encourage a restaurant manager to be more...
asked 14 seconds from now -
Re: Human Physiology
Comment on the differences between representing V02 max as an
absolute number and...
asked 2 minutes ago -
A firm with a WACC of 10% is considering the following mutually
exclusive projects:
0
1...
asked 6 minutes ago -
. A 100.0 mL sample of 0.18 M HClO4 is titrated with 0.27 M
LiOH. Determine...
asked 30 minutes ago -
A regression equation that describes the relationship between
the amount of the bill ($) at a...
asked 1 hour ago -
exercise on VSEPR and molecular structrue.
octahedral
SeCl62-
TeCl62-
ClF62-
distorted
SeF62–
IF6–
asked 1 hour ago -
284 mL of a 0.52 M potassium hydroxide solution is added to 467
mL of a...
asked 1 hour ago -
Little’s Law: Val d’Costa is a world famous ski village in the
French Alps. Because of...
asked 2 hours ago -
Find the absolute error D for the calculation if A + B/C=D A=
9.4 +/- 0.4...
asked 3 hours ago -
New Air Heating and Cooling, manufactures furnaces and central
air units. The company pride itself on...
asked 3 hours ago -
A coach uses a new technique to train gymnasts. Seven
gymnasts were randomly selected and their...
asked 5 hours ago -
While rotating the tires on your car you notice a rock [mass =
0.1 Kg] stuck...
asked 7 hours ago