

Homework Answers
Study-3) As we have to test average so
13) We use t-test for means
14) The null and the alternative hypothesis are
 and
and 
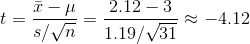
15) The value of the test static is given by
16) The test is one tailed test and number of degrees of freedom
is 
So P-value is 
As P-value is very small
We reject the null hypothesis
17) Not applicable
18) So by t test there is enough evidence to support the claim that sample mean is smaller than what is predicted.

Add Answer to:
Below are descriptions of some research studies. Each description contains sufficient information to determine the correct...
Below are descriptions of some research studies. Each description contains sufficient information to determine the correct...
 Below are descriptions of some research studies. Each description contains sufficient information to determine the correct statistical test to use. Your task is 1) to determine which is the correct test, 2) to perform that test using our five-step hypothesis testing procedure, and 3) to make a decision about the null hypothesis using the results of the test. Choose your tests from these options: single-sample i test dependent-measures / test independent-measures t test Please report your answers in the following...
in comparing the engagement levels of first-year statistics students. In a previous nation-wide study, engagement levels...
in comparing the engagement levels of first-year statistics students. In a previous nation-wide study, engagement levels were found to be normally distributed, with µ=60.00, σ=10.00. The lecturer collects a convenience sample of 50 first-year students and finds that her students have a mean engagement level equal to 75.54. What statistical procedure should be used, to test whether there is a significant mean difference in engagement levels between the lecturer’s first year students and the population average? a. One sample Z-test....
this is a single sample t test problem this is math Assignment #11 Single Sample t-Test...
 this is a single sample t test problem
this is math
Assignment #11 Single Sample t-Test What factor determines whether you should use a z-test or a t-test statistic for a hypothesis test? 11.1 A sample is selected from a population mean of u 30. A treatment is administered to the individuals in the sample and, after treatment, the sample mean found to be M 11.2 = 31.3 with a sample variance of s2 9 If the sample consists of...
this is a single sample t test problem
this is math
Assignment #11 Single Sample t-Test What factor determines whether you should use a z-test or a t-test statistic for a hypothesis test? 11.1 A sample is selected from a population mean of u 30. A treatment is administered to the individuals in the sample and, after treatment, the sample mean found to be M 11.2 = 31.3 with a sample variance of s2 9 If the sample consists of...
Multi-step Caleulations. For the following items, you will be performing a series of statisica processes, including...
 Multi-step Caleulations. For the following items, you will be performing a series of statisica processes, including creation of tables/charts and computation of statistics/parameters. Please carefully read the instructions for each item. Show your work, and clearly indicate your final answer es of statistical MSC1. An office manager has tracked data on the average number of employee complaints hi department receives per week for several years (H-2.4). Recently, corporate policy have not been well-received, and he suspects that the number of...
Research examining the effects of preschool child care has found that children who spent time in...
Research examining the effects of preschool child care has found that children who spent time in day care, especially high-quality day care, perform better on math and language tests than children who say home with their mothers (Broberg, Wessels, Lamb, & Hwang, 1997). In a typical study, a researcher obtains a sample of n = 10 children who attended day care before starting school. Then children are given a standardized math test for which the population mean is μ =...
please help with 4 & 6 3. For each of the following situations determine whether a...
 please help with 4 & 6
3. For each of the following situations determine whether a one- or a two-tailed test is appropriate. Also, state the research and the null hypotheses. a. You are interested in finding out if the average household income of residents in your state is different from the national average household. According to the U.S. Census, for 2014, the national average household income is $53,657.15 b. You believe that students in small liberal arts colleges attend...
please help with 4 & 6
3. For each of the following situations determine whether a one- or a two-tailed test is appropriate. Also, state the research and the null hypotheses. a. You are interested in finding out if the average household income of residents in your state is different from the national average household. According to the U.S. Census, for 2014, the national average household income is $53,657.15 b. You believe that students in small liberal arts colleges attend...
The z-tests Help with this page is greatly appreciated. I dont understand how to show a full diagram. Thanks in advance :) The z-test 10.1 Assume that a treatment does have an effect and that th...
 The
z-tests
Help with this page is greatly appreciated. I dont understand
how to show a full diagram. Thanks in advance :)
The z-test 10.1 Assume that a treatment does have an effect and that the treatment effect is being evaluated with a z hypothesis test. If all factors are held constant, how is the outcome of the hypothesis test influenced by sample size? To answer this question, do the following two tests and compare the results. For both tests,...
The
z-tests
Help with this page is greatly appreciated. I dont understand
how to show a full diagram. Thanks in advance :)
The z-test 10.1 Assume that a treatment does have an effect and that the treatment effect is being evaluated with a z hypothesis test. If all factors are held constant, how is the outcome of the hypothesis test influenced by sample size? To answer this question, do the following two tests and compare the results. For both tests,...
please do all of the steps Zoom 125% Insert Table Chart Text Shape Media Comment For...
 please
do all of the steps
Zoom 125% Insert Table Chart Text Shape Media Comment For each of the following studies, conduct the 4 steps of hypothesis testing with the z test. If you find it helpful, you can use the boxes on the right to sketch out a normal curve, plot your crew, shade in the region of rejection, and plot your job to help you visualize your decision. Benodo owns an ACT Prep company. He believes that students...
please
do all of the steps
Zoom 125% Insert Table Chart Text Shape Media Comment For each of the following studies, conduct the 4 steps of hypothesis testing with the z test. If you find it helpful, you can use the boxes on the right to sketch out a normal curve, plot your crew, shade in the region of rejection, and plot your job to help you visualize your decision. Benodo owns an ACT Prep company. He believes that students...
For my PSY230 course, I started a new practice of offering extra credit for making an...
For my PSY230 course, I started a new practice of offering extra credit for making an appointment with the Statistics and Methods Lab. The goal is to help students feel more positive toward statistics through one-on-one assistance and therefore feel more comfortable in the course. In order to see if this new element was effective, I compared results from a statistics attitude survey given to my current class to the existing pool of past statistics attitude surveys from all my...
 Below are descriptions of some research studies. Each description contains sufficient information to determine the correct statistical test to use. Your task is 1) to determine which is the correct test, 2) to perform that test using our five-step hypothesis testing procedure, and 3) to make a decision about the null hypothesis using the results of the test. Choose your tests from these options: single-sample i test dependent-measures / test independent-measures t test Please report your answers in the following...
 Below are descriptions of some research studies. Each description contains sufficient information to determine the correct statistical test to use. Your task is 1) to determine which is the correct test, 2) to perform that test using our five-step hypothesis testing procedure, and 3) to make a decision about the null hypothesis using the results of the test. Choose your tests from these options: single-sample i test dependent-measures / test independent-measures t test Please report your answers in the following...
 this is a single sample t test problem
this is math
Assignment #11 Single Sample t-Test What factor determines whether you should use a z-test or a t-test statistic for a hypothesis test? 11.1 A sample is selected from a population mean of u 30. A treatment is administered to the individuals in the sample and, after treatment, the sample mean found to be M 11.2 = 31.3 with a sample variance of s2 9 If the sample consists of...
this is a single sample t test problem
this is math
Assignment #11 Single Sample t-Test What factor determines whether you should use a z-test or a t-test statistic for a hypothesis test? 11.1 A sample is selected from a population mean of u 30. A treatment is administered to the individuals in the sample and, after treatment, the sample mean found to be M 11.2 = 31.3 with a sample variance of s2 9 If the sample consists of...
 Multi-step Caleulations. For the following items, you will be performing a series of statisica processes, including creation of tables/charts and computation of statistics/parameters. Please carefully read the instructions for each item. Show your work, and clearly indicate your final answer es of statistical MSC1. An office manager has tracked data on the average number of employee complaints hi department receives per week for several years (H-2.4). Recently, corporate policy have not been well-received, and he suspects that the number of...
 please help with 4 & 6
3. For each of the following situations determine whether a one- or a two-tailed test is appropriate. Also, state the research and the null hypotheses. a. You are interested in finding out if the average household income of residents in your state is different from the national average household. According to the U.S. Census, for 2014, the national average household income is $53,657.15 b. You believe that students in small liberal arts colleges attend...
please help with 4 & 6
3. For each of the following situations determine whether a one- or a two-tailed test is appropriate. Also, state the research and the null hypotheses. a. You are interested in finding out if the average household income of residents in your state is different from the national average household. According to the U.S. Census, for 2014, the national average household income is $53,657.15 b. You believe that students in small liberal arts colleges attend...
 The
z-tests
Help with this page is greatly appreciated. I dont understand
how to show a full diagram. Thanks in advance :)
The z-test 10.1 Assume that a treatment does have an effect and that the treatment effect is being evaluated with a z hypothesis test. If all factors are held constant, how is the outcome of the hypothesis test influenced by sample size? To answer this question, do the following two tests and compare the results. For both tests,...
The
z-tests
Help with this page is greatly appreciated. I dont understand
how to show a full diagram. Thanks in advance :)
The z-test 10.1 Assume that a treatment does have an effect and that the treatment effect is being evaluated with a z hypothesis test. If all factors are held constant, how is the outcome of the hypothesis test influenced by sample size? To answer this question, do the following two tests and compare the results. For both tests,...
 please
do all of the steps
Zoom 125% Insert Table Chart Text Shape Media Comment For each of the following studies, conduct the 4 steps of hypothesis testing with the z test. If you find it helpful, you can use the boxes on the right to sketch out a normal curve, plot your crew, shade in the region of rejection, and plot your job to help you visualize your decision. Benodo owns an ACT Prep company. He believes that students...
please
do all of the steps
Zoom 125% Insert Table Chart Text Shape Media Comment For each of the following studies, conduct the 4 steps of hypothesis testing with the z test. If you find it helpful, you can use the boxes on the right to sketch out a normal curve, plot your crew, shade in the region of rejection, and plot your job to help you visualize your decision. Benodo owns an ACT Prep company. He believes that students...
Most questions answered within 3 hours.
-
Transverse waves on a string have wave speed 8 m/s, amplitude
0.071 m, and wavelength 0.33...
asked 1 minute ago -
At −11°C a sample of carbon monoxide gas exerts a pressure of
0.45 atm. What is...
asked 2 minutes ago -
Aqueous hydrobromic acid HBr reacts with solid sodium hydroxide
NaOH to produce aqueous sodium bromide NaBr...
asked 16 minutes ago -
You dissolve 1.0 mole of a substance in water to a total volume
of 1,000 ml....
asked 20 minutes ago -
A company's total assets at the end of last year were 500,000
and its EBIT was...
asked 25 minutes ago -
Is it redundant to say that a pure substance is homogeneous, or
can it not be...
asked 29 minutes ago -
Already famous by the time he arrived at Princeton University in
1933, Einstein had suggested a...
asked 48 minutes ago -
Suppose the average male brain weight (in grams) is estimated to
be 13201320 grams. A 1905...
asked 56 minutes ago -
For each molecular substance (a) H3PO2 and (b) C6H5NH2,
calculate its molecular mass and write a...
asked 49 minutes ago -
The inheritance of color blindness in humans is due to a
recessive gene located on the...
asked 53 minutes ago -
Aqueous sulfuric acid (H2SO4) reacts with solid sodium hydroxide
(NaOH) to produce aqueous sodium sulfate (Na2SO4)...
asked 54 minutes ago -
QUESTION 25:
Find the pure binary representation of the following decimal
value: You DO NOT need...
asked 57 minutes ago