Thank You in advance for whoever is helping me!. All the
blank/red spaces are wrong. I just need help its so hard to figure
out. Thank YOu


Homework Answers
Answer:
a.
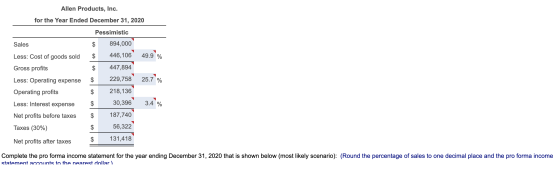
| Allen Products, Inc | ||
| for the Year Ended December 31, 2020 | ||
| Pessimistic | ||
| Sales | 894,000 | |
| Less cost of goods sold | 381,738 | 42.7% |
| Gross profits | 512,262 | |
| Less operating expense | 180,588 | 20.2% |
| Operating profits | 331,674 | |
| Less interest expense | 31,290 | 3.5% |
| Net profit before taxes | 300,384 | |
| Taxes | 90,115 | |
| Net profits after taxes | 210,269 |
| Allen Products, Inc | ||
| for the Year Ended December 31, 2020 | ||
| Most Likely | ||
| Sales | 1,134,000 | |
| Less cost of goods sold | 484,218 | 42.7% |
| Gross profits | 649,782 | |
| Less operating expense | 229,068 | 20.2% |
| Operating profits | 420,714 | |
| Less interest expense | 39,690 | 3.5% |
| Net profit before taxes | 381,024 | |
| Taxes | 114,307 | |
| Net profits after taxes | 266,717 |
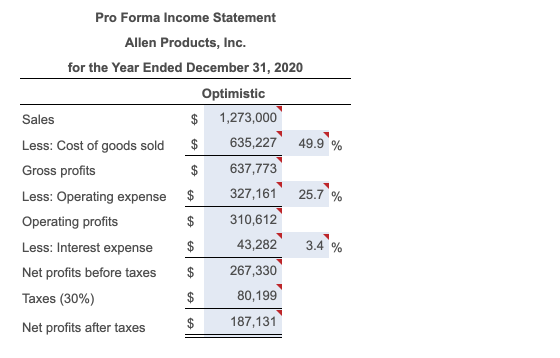
| Allen Products, Inc | ||
| for the Year Ended December 31, 2020 | ||
| Optimistic | ||
| Sales | 1,281,000 | |
| Less cost of goods sold | 546,987 | 42.7% |
| Gross profits | 734,013 | |
| Less operating expense | 258,762 | 20.2% |
| Operating profits | 475,251 | |
| Less interest expense | 44,835 | 3.5% |
| Net profit before taxes | 430,416 | |
| Taxes | 129,125 | |
| Net profits after taxes | 301,291 |
b.
When using the percent-of-sales method, it assumes that all the costs are variable and hence there are no fixed expenses. So in the pessimistic situation, this will cause all costs to decrease with the loweest level of sales. But usually the fixed costs will not decrease.It is opposite in case of the optimistic situation as the percent-of-sales assumes that the variable costs will increase.
c.
| Allen Products, Inc | ||
| for the Year Ended December 31, 2020 | ||
| Pessimistic | ||
| Sales | 894,000 | |
| Less cost of goods sold | ||
| Fixed | 215,673 | |
| Variable | 176,118 | 19.7% |
| Gross profits | 502,209 | |
| Less operating expense | ||
| Fixed | 132,722 | |
| Variable | 53,640 | 6.0% |
| Operating profits | 315,847 | |
| Less interest expense | 32,799 | |
| Net profit before taxes | 283,048 | |
| Taxes | 84,914 | |
| Net profits after taxes | 198,134 |
| Allen Products, Inc | ||
| for the Year Ended December 31, 2020 | ||
| Most Likely | ||
| Sales | 1,134,000 | |
| Less cost of goods sold: | ||
| Fixed | 215,673 | |
| Variable | 223,398 | 19.7% |
| Gross profits | 694,929 | |
| Less operating expense: | ||
| Fixed | 132,722 | |
| Variable | 68,040 | 6.0% |
| Operating profits | 494,167 | |
| Less interest expense | 32,799 | |
| Net profit before taxes | 461,368 | |
| Taxes | 138,410 | |
| Net profits after taxes | 322,958 |
| Allen Products, Inc | ||
| for the Year Ended December 31, 2020 | ||
| Optimistic | ||
| Sales | 1,281,000 | |
| Less cost of goods sold | ||
| Fixed | 215,673 | |
| Variable | 252,357 | 19.7% |
| Gross profits | 812,970 | |
| Less operating expense | ||
| Fixed | 132,722 | |
| Variable | 76,860 | 6.0% |
| Operating profits | 603,388 | |
| Less interest expense | 32,799 | |
| Net profit before taxes | 570,589 | |
| Taxes | 171,177 | |
| Net profits after taxes | 399,412 |
d.
The profits for the pessimistic situation is hgher in question (a) than in question (c).
The profits for the optimistic situation is lesser in question (a) than in question (c).
Calculation:
a.
To perform the percent-of-sales method, and calculate the estimates to develop pessimistic, most likely, and optimistic pro forma income statements for the 2020, first we need to take the income statement provided in the question and take the Sales as the base.
| Sales (a) | 937,100 | |
| Less cost of goods sold (b) | 400,142 | 42.7% (b)/(a) |
| Gross profits | 536,958 | |
| Less operating expense (c) | 189,294 | 20.2% (c)/(a) |
| Operating profits | 347,664 | |
| Less interest expense (d) | 32,799 | 3.5% (d)/(a) |
| Net profit before taxes | 314,865 | |
| Taxes | 78,716 | |
| Net profits after taxes | 236,149 |
Then we need to multiply the percentage with the pessimistic prediction for sales is $894,000; the most likely amount of sales is $1,134,000; and the optimistic prediction is $1,281,000.
The tax rate is changed to 30% so we need to consider that while calculating taxes.
c.
Here we need to restate the pro forma income statements prepared with the fixed cost of goods sold as 215,673 and the fixed operating expenses as 132,722. Here the interest expense is fixed.
So to calculate the variable portion we need to do the below calculation:
Cost of goods sold variable percentage = ($400,142 - $215,673) / $937,100 = 19.7%
Operating expense variable percentage=($189,294 - $132,722) / $937,100 = 6.0%
Then we need to multiply the percentage with the pessimistic prediction for sales is $894,000; the most likely amount of sales is $1,134,000; and the optimistic prediction is $1,281,000.
The tax rate is changed to 30% so we need to consider that while calculating taxes.
Add Answer to:
Thank You in advance for whoever is helping me!. All the
blank/red spaces are wrong. I...
Using the below information: Sales revenue $937,600 Less: cost of good sold Fixed 257,205 Variable 171,278...
Using the below information: Sales revenue $937,600 Less: cost of good sold Fixed 257,205 Variable 171,278 Gross profits $509,117 Less: operating expenses Fixed 202,533 Variable 54,369 Operating profits $252,215 Less: interest expense 29,066 Net profit before taxes $223,149 Less: taxes (rate 25%) 55,787 Net profits after taxes $167,362 Allen Products LP, wants to do a scenario analysis for the coming year. The pessimistic prediction for sales is $894,000; the most likely amount of sales is $1,124,000; and the optimistic prediction...
Allen Products. Inc. Income Statement for the Year Ended December 31, 2019 Sales revenue Less: cost...
 Allen Products. Inc. Income Statement for the Year Ended December 31, 2019 Sales revenue Less: cost of good sold Gross profits Less: operating expenses Operating profits Less: interest expense Net profit before taxes Less: taxes (rate 30%) Net profits after taxes $936,700 443,996 5492,704 211,694 $281,010 29,038 5251,972 75,592 $176,380 Allen Products, Inc. Income Statement for the Year Ended December 31, 2019 Sales revenue Less: cost of good sold 936,700 271,115 172,881 $492,704 Fixed Variable Gross profits Less: operating expenses...
Pro forma income statement-Scenario analysis Allen Products LP, wants to do a scenario analysis for the...
Pro forma income statement-Scenario analysis Allen Products LP, wants to do a scenario analysis for the coming year. The pessimistic prediction for sales is $909,000; the most likely amount of sales is $1,132,000; and the optimistic prediction is $1,286,000. Allens income statement for the most recent year is shown below. Use the percent-of-sales method, the income statement for December 31, 2019, and the sales revenue estimates to develop pessimistic, most likely, and optimistic pro forma income statements for the coming...
Pro forma income statement-Scenario analysis Allen Products LP, wants to do a scenario analysis for the...
 Pro forma income statement-Scenario analysis Allen Products LP, wants to do a scenario analysis for the coming year. The pessimistic prediction for sales is $905,000; the most likely amount of sales is $1,120,000, and the optimistic prediction is $1,271,000 Allen's income statement for the most recent year is shown here a. Use the percent-of-sales method, the income statement for December 31, 2019, and the sales revenue estimates to develop pessimistic, most likely, and optimistic pro forma income statements for the...
Pro forma income statement-Scenario analysis Allen Products LP, wants to do a scenario analysis for the...
 Pro forma income statement-Scenario analysis Allen Products LP, wants to do a scenario analysis for the coming year. The pessimistic prediction for sales is $905,000; the most likely amount of sales is $1,120,000; and the optimistic prediction is $1,271,000. Allen's income statement for the most recent year is shown here EEB a. Use the percent-of-sales method, the income statement for December 31, 2019, and the sales revenue estimates to develop pessimistic, most likely, and optimistic pro forma income statements for...
Using the below information: Allen Products, Inc. Income Statement for the Year Ended December 31, 2019 Sales revenue ...
Using the below information: Allen Products, Inc. Income Statement for the Year Ended December 31, 2019 Sales revenue $937,800 Less: cost of good sold 378,871 Gross profits $558,929 Less: operating expenses 223,196 Operating profits $335,733 Less: interest expense 32,823 Net profit before taxes $302,910 Less: taxes (rate 30%) 90,873 Net profits after taxes $212,037 Allen Products LP, wants to do a scenario analysis for the coming year. The pessimistic prediction for sales is $890,000; the most likely amount of sales...
Allen Products LP, wants to do a scenario analysis for the coming year. The pessimistic prediction...
Allen Products LP, wants to do a scenario analysis for the coming year. The pessimistic prediction for sales is $ 901,000; the most likely amount of sales is $ 1,126,000; and the optimistic prediction is $ 1,288,000. Allen's income statement for the most recent year is shown here Allen Products, Inc. Income Statement for the Year Ended December 31, 2019 Sales revenue $937,200 Less: cost of goods sold 389,875 Gross profits $547,325 Less: operating expenses 251,170 Operating profits $296,155 Less:...
CHAPTER 4 Long- and Short-Term Financial Planning 183 *P4-17 Pro forma income statement: Scenario analysis Allen...
 CHAPTER 4 Long- and Short-Term Financial Planning 183 *P4-17 Pro forma income statement: Scenario analysis Allen Products Inc. wants to do a scenario analysis for the coming year. The pessimistic prediction for sales is $900,000; the most likely amount of sales is $1,125.000; and the optimistic predic- tion is $1,280,000. Allen's income statement for the most recent year follows. Allen Products Inc. Income Statement for the Year Ended December 31, 2019 Sales revenue $937,500 Less: Cost of goods sold 421,875...
Allen Products LP, wants to do a scenario analysis for the coming year. The pessimistic prediction...
Allen Products LP, wants to do a scenario analysis for the coming year. The pessimistic prediction for sales is $898,000; the most likely amount of sales is $1,120,000; and the optimistic prediction is $1,278,000. Allen's income statement for the most recent year is shown here Sales revenue $937,100 Less: cost of good sold Fixed 274,807 Variable 175,938 Gross profits $486,355 Less: operating expenses Fixed 175,927 Variable 59,285 Operating profits $251,143 Less: interest expense 29,050 Net profit before taxes $222,093...
Pro forma income statement The marketing department of Metroline Manufacturing estimates that its sales in 2020...
 Pro forma income statement The marketing department of Metroline Manufacturing estimates that its sales in 2020 will be $1.55 million. Interest expense is expected to remain unchanged at $36,000, and the firm plans to pay $65,000 in cash dividends during 2020. Metroline Manufacturing's income statement for the year ended December 31, 2019, is given , along with a breakdown of the firm's cost of goods sold and operating expenses into their fixed and variable components. a. Use the percent-of-sales method...
 Allen Products. Inc. Income Statement for the Year Ended December 31, 2019 Sales revenue Less: cost of good sold Gross profits Less: operating expenses Operating profits Less: interest expense Net profit before taxes Less: taxes (rate 30%) Net profits after taxes $936,700 443,996 5492,704 211,694 $281,010 29,038 5251,972 75,592 $176,380 Allen Products, Inc. Income Statement for the Year Ended December 31, 2019 Sales revenue Less: cost of good sold 936,700 271,115 172,881 $492,704 Fixed Variable Gross profits Less: operating expenses...
 Pro forma income statement-Scenario analysis Allen Products LP, wants to do a scenario analysis for the coming year. The pessimistic prediction for sales is $905,000; the most likely amount of sales is $1,120,000, and the optimistic prediction is $1,271,000 Allen's income statement for the most recent year is shown here a. Use the percent-of-sales method, the income statement for December 31, 2019, and the sales revenue estimates to develop pessimistic, most likely, and optimistic pro forma income statements for the...
 Pro forma income statement-Scenario analysis Allen Products LP, wants to do a scenario analysis for the coming year. The pessimistic prediction for sales is $905,000; the most likely amount of sales is $1,120,000; and the optimistic prediction is $1,271,000. Allen's income statement for the most recent year is shown here EEB a. Use the percent-of-sales method, the income statement for December 31, 2019, and the sales revenue estimates to develop pessimistic, most likely, and optimistic pro forma income statements for...
 CHAPTER 4 Long- and Short-Term Financial Planning 183 *P4-17 Pro forma income statement: Scenario analysis Allen Products Inc. wants to do a scenario analysis for the coming year. The pessimistic prediction for sales is $900,000; the most likely amount of sales is $1,125.000; and the optimistic predic- tion is $1,280,000. Allen's income statement for the most recent year follows. Allen Products Inc. Income Statement for the Year Ended December 31, 2019 Sales revenue $937,500 Less: Cost of goods sold 421,875...
 Pro forma income statement The marketing department of Metroline Manufacturing estimates that its sales in 2020 will be $1.55 million. Interest expense is expected to remain unchanged at $36,000, and the firm plans to pay $65,000 in cash dividends during 2020. Metroline Manufacturing's income statement for the year ended December 31, 2019, is given , along with a breakdown of the firm's cost of goods sold and operating expenses into their fixed and variable components. a. Use the percent-of-sales method...
Most questions answered within 3 hours.
-
If a block of Si is doped with 10^17 Boron atom/cm^3 and 5X10^16
Arsenic atoms/cm^3,
(a)...
asked 19 minutes ago -
Why would natural selection not minimize costs (in the form of
symptoms) of evolved defenses? (choose...
asked 37 minutes ago -
What is true about a critical task?
Latest finish time - latest start time = 0...
asked 39 minutes ago -
A company uses a
process costing system. Its Assembly Department's beginning
inventory consisted of 56,800 units,...
asked 39 minutes ago -
a
sealed glass cylinder contains 325 g of N2 gas at 1.02 atm at 20 c....
asked 43 minutes ago -
The main difference between an equity and a nonequity alliance
is that
A
equity alliances are...
asked 42 minutes ago -
Need help with this, in JAVA, using netbeans. A
complete response will receive a positive comment...
asked 50 minutes ago -
An imprest petty cash fund of $600 was established for minor
disbursements. At the end of...
asked 55 minutes ago -
Sharpe Cutter is a small company that produces specialty knives
for paper cutting machinery. The annual...
asked 59 minutes ago -
Calculating the Ka of a weak acid from
pH:
The pH of a 0.68M solution of...
asked 1 hour ago -
1.What process is pushing back against gravity in the very
center (the core) of sun-like stars?...
asked 1 hour ago -
This question is from the textbook "Python for ArcGIS" by Laura
Tateosian:
Write a script "triangles.py"...
asked 1 hour ago