- Instead of “cash,” the company’s balance sheet uses the account name “Cash and cash equivalents.” How does the company define cash equivalents?
- The annual report has two reports in which management is clearly identified as having for the company’s financial reporting and internal controls. What are the names of these reports and on what pages are they located?

Homework Answers
Request Answer!
We need at least 10 more requests to produce the answer.
0 / 10 have requested this problem solution
The more requests, the faster the answer.
Add Answer to:
Instead of “cash,” the company’s balance sheet uses the account
name “Cash and cash equivalents.” How...
Calculate the altman Z-score that is the question 12. Calculate the market-to-book ratio of the company...
 Calculate the altman Z-score that is the question
12. Calculate the market-to-book ratio of the company as of Feb 2, 2019. This is the Feb 2, 2019 market capitalization of the stock divided by the latest book value of shareholders' equity. Target's stock closed at $68.97 per share on the last trading day of the fiscal year, which was Feb 1, 2019. Shane price X share 2. Bankruptcy Risk. Calculate the Altman Z-Score as of the 2018 balance sheet date....
Calculate the altman Z-score that is the question
12. Calculate the market-to-book ratio of the company as of Feb 2, 2019. This is the Feb 2, 2019 market capitalization of the stock divided by the latest book value of shareholders' equity. Target's stock closed at $68.97 per share on the last trading day of the fiscal year, which was Feb 1, 2019. Shane price X share 2. Bankruptcy Risk. Calculate the Altman Z-Score as of the 2018 balance sheet date....
Compare income statment and balance sheet for the last two years any changes? analyize cash flow ...
 compare income statment and balance sheet for the last two
years
any changes?
analyize cash flow
operating activities
investing activities
financing activities
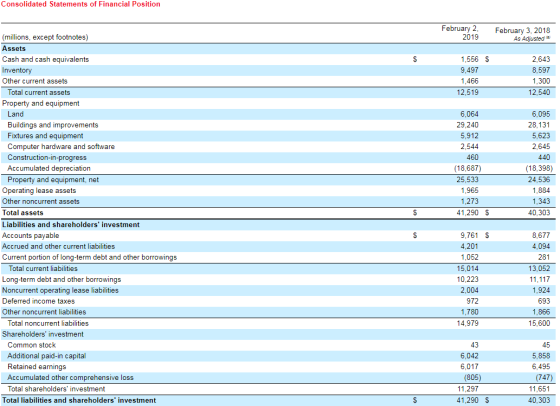
of Financial Position Statements February 3, Janua millions, except footnotes) $ 2,643 $ 2,512 8,309 1.169 11,990 8,657 1,264 12,564 equivalents Cash and cash Other current assets Total current assets Property and equipment 6,095 28,396 5,623 2,645 6,106 27,611 5,503 2,651 Buildings and improvements Fixtures and equipment Computer hardware and software 440 200 Construction-in-progress Accumulated depreciation (18,181) (17,413)...
compare income statment and balance sheet for the last two
years
any changes?
analyize cash flow
operating activities
investing activities
financing activities
of Financial Position Statements February 3, Janua millions, except footnotes) $ 2,643 $ 2,512 8,309 1.169 11,990 8,657 1,264 12,564 equivalents Cash and cash Other current assets Total current assets Property and equipment 6,095 28,396 5,623 2,645 6,106 27,611 5,503 2,651 Buildings and improvements Fixtures and equipment Computer hardware and software 440 200 Construction-in-progress Accumulated depreciation (18,181) (17,413)...
For Target in 2018, what were Capital Expenditures? Round to nearest $mm and use the $...
 For Target in 2018, what were Capital Expenditures? Round to
nearest $mm and use the $ symbol (e.g $3,234 would be a correct
form). Do not use parentheses or negative symbols.
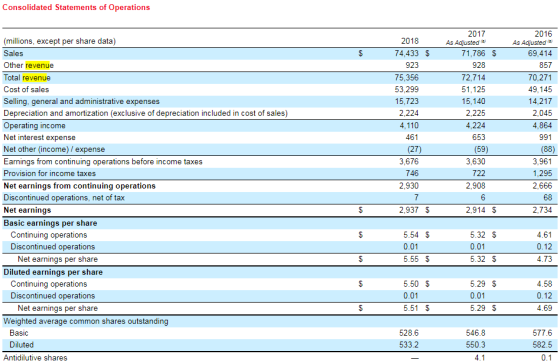
2017 2018 As Adjusted As Adjusted 2016 (millions, except per share data) S Sales 74,433 71,786 69,414 Other revenue 923 928 857 Total revenue 75,356 70,271 72,714 Cost of sales 53,299 51,125 49,145 Selling, general and administrative expenses 15,723 15,140 14,217 Depreciation and amortization (exclusive of depreciation induded in...
For Target in 2018, what were Capital Expenditures? Round to
nearest $mm and use the $ symbol (e.g $3,234 would be a correct
form). Do not use parentheses or negative symbols.
2017 2018 As Adjusted As Adjusted 2016 (millions, except per share data) S Sales 74,433 71,786 69,414 Other revenue 923 928 857 Total revenue 75,356 70,271 72,714 Cost of sales 53,299 51,125 49,145 Selling, general and administrative expenses 15,723 15,140 14,217 Depreciation and amortization (exclusive of depreciation induded in...
Compute ROA, Profit Margin, and Asset Turnover Refer to the financial information for Target Corporation, presented...
 Compute ROA, Profit Margin, and Asset Turnover Refer to the financial information for Target Corporation, presented below: Target Corporation Balance Sheets January 31, February 1, ($ millions) 2015 2014 Assets Cash and cash equivalents $2,210 $670 Inventory 8,790 8,278 Other current assets 3,087 2,625 Total current assets 14,087 11,573 Property and equipment, net 25,958 26,412 Other noncurrent assets 1,359 6,568 Total assets $41,404 $44,553 Liabilities and shareholders' investment 59 Accounts payable Accrued and other current liabilities Current portion of long-term...
2015 Analysis and Interpretation of Liquidity and Solvency Refer to the financial information for Target Corporation...
 2015 Analysis and Interpretation of Liquidity and Solvency Refer to the financial information for Target Corporation (TGT), presented below, to answer the following. Target Corporation Balance Sheets January 31, February 1, ($ millions) 2014 Assets Cash and cash equivalents $2,210 $670 Inventory 8,790 8,278 Other current assets 3,087 2,625 Total current assets 14,087 11,573 Property and equipment, net 25,958 26,412 Other noncurrent assets 1,359 6,568 Total assets $41,404 $44,553 Liabilities and shareholders' investment Accounts payable $7,759 $7,335 Accrued and other...
Common-Size Balance Sheets Following is the balance sheet for Target Corporation. Prepare Target's common-size balance sheets...
 Common-Size Balance Sheets Following is the balance sheet for Target Corporation. Prepare Target's common-size balance sheets as of January 31, 2015 and February 1, 2014 (Round your answers to one decimal place.) January 31, February 1, (5 millions) 2015 2014 Assets Cash and cash equivalents 52.210 5670 Inventory 8.790 Other current assets 2.625 Total current assets 14,087 11,573 Property and equipment, net 25,958 26,412 Other noncurrent assets 1,359 6,568 Total assets $41,404 $44,553 Liabilities and shareholders' investment Accounts payable 57,759...
% 100.00% % 100,00% Vertical Analysis - Income Statement Target Corporation INSTRUCTIONS Change XX to the...
 % 100.00% % 100,00% Vertical Analysis - Income Statement Target Corporation INSTRUCTIONS Change XX to the year of the report you are analyzing. You may have to insert additional rows FY 2010 3 hed on the actual Target Consolidated statement 4 Sales $ 74,433 Cost of sales 53,299 Gross margin $ 21,134 7 Selling, general, and administrative expenses Depreciation and amortization 2.224 9 Gain on sale 10 Earnings from continuing operations before interest and taxes $ 3,187 11 Net interest...
February 2. January 21 2018 2017 52.643 8652 1.264 12.564 25.018 1.417 538.999 52.512 8309 1.169...
 February 2. January 21 2018 2017 52.643 8652 1.264 12.564 25.018 1.417 538.999 52.512 8309 1.169 11.990 24,658 783 (5 millions) Assets Cash and cash equivalents Inventory Other current assets Total current assets Property and equipment, net Other noncurrent assets Total assets Liabilities and shareholders' investment Accounts payable Accrued and other current lite Current portion of long term debt and notes payable Total current liabilities Long-term debit Deferred income taxes Other noncurrent liabilities Total shareholders Investment Total liabilities and shareholders'...
P4-29. Compute and Interpret Liquidity, Solvency, and Coverage Ratios Information from the balance sheet, income statement,...
 P4-29. Compute and Interpret Liquidity, Solvency, and Coverage Ratios Information from the balance sheet, income statement, and statement of cash flows for Lockheed Martin Corporation follow. Refer to these financial statements to answer the requirements. 2016 2015 $40,365 6,883 $34,868 5,668 40,536 47,248 (36,616) (6,040) (31,091) (4,824) (82) LOCKHEED MARTIN CORPORATION Consolidated Statements of Earnings Year Ended December 31 (in millions) Net sales Products.. Services .... Total net sales ........ Cost of sales Products ..... Services Severance charges.. Other unallocated,...
Problem 2 On the following page, I have attached PG Company’s Consolidated Statements of Earnings for...
 Problem 2
On the following page, I have attached PG Company’s Consolidated
Statements of Earnings for the 3 fiscal year’s ending June 30,
2019.
Required:Using the attached earnings statement, for each period
presented,
Compute the gross margin %
Note: Gross margin % = [(Net sales –
Cost of products sold)/Net sales] x 100
Compute the net profit margin on sales %
Note: Net profit margin % = (Net
earnings attributable to PG/Net sales) x 100
Considering the 3-year trend for...
Problem 2
On the following page, I have attached PG Company’s Consolidated
Statements of Earnings for the 3 fiscal year’s ending June 30,
2019.
Required:Using the attached earnings statement, for each period
presented,
Compute the gross margin %
Note: Gross margin % = [(Net sales –
Cost of products sold)/Net sales] x 100
Compute the net profit margin on sales %
Note: Net profit margin % = (Net
earnings attributable to PG/Net sales) x 100
Considering the 3-year trend for...
 Calculate the altman Z-score that is the question
12. Calculate the market-to-book ratio of the company as of Feb 2, 2019. This is the Feb 2, 2019 market capitalization of the stock divided by the latest book value of shareholders' equity. Target's stock closed at $68.97 per share on the last trading day of the fiscal year, which was Feb 1, 2019. Shane price X share 2. Bankruptcy Risk. Calculate the Altman Z-Score as of the 2018 balance sheet date....
Calculate the altman Z-score that is the question
12. Calculate the market-to-book ratio of the company as of Feb 2, 2019. This is the Feb 2, 2019 market capitalization of the stock divided by the latest book value of shareholders' equity. Target's stock closed at $68.97 per share on the last trading day of the fiscal year, which was Feb 1, 2019. Shane price X share 2. Bankruptcy Risk. Calculate the Altman Z-Score as of the 2018 balance sheet date....
 compare income statment and balance sheet for the last two
years
any changes?
analyize cash flow
operating activities
investing activities
financing activities
of Financial Position Statements February 3, Janua millions, except footnotes) $ 2,643 $ 2,512 8,309 1.169 11,990 8,657 1,264 12,564 equivalents Cash and cash Other current assets Total current assets Property and equipment 6,095 28,396 5,623 2,645 6,106 27,611 5,503 2,651 Buildings and improvements Fixtures and equipment Computer hardware and software 440 200 Construction-in-progress Accumulated depreciation (18,181) (17,413)...
compare income statment and balance sheet for the last two
years
any changes?
analyize cash flow
operating activities
investing activities
financing activities
of Financial Position Statements February 3, Janua millions, except footnotes) $ 2,643 $ 2,512 8,309 1.169 11,990 8,657 1,264 12,564 equivalents Cash and cash Other current assets Total current assets Property and equipment 6,095 28,396 5,623 2,645 6,106 27,611 5,503 2,651 Buildings and improvements Fixtures and equipment Computer hardware and software 440 200 Construction-in-progress Accumulated depreciation (18,181) (17,413)...
 For Target in 2018, what were Capital Expenditures? Round to
nearest $mm and use the $ symbol (e.g $3,234 would be a correct
form). Do not use parentheses or negative symbols.
2017 2018 As Adjusted As Adjusted 2016 (millions, except per share data) S Sales 74,433 71,786 69,414 Other revenue 923 928 857 Total revenue 75,356 70,271 72,714 Cost of sales 53,299 51,125 49,145 Selling, general and administrative expenses 15,723 15,140 14,217 Depreciation and amortization (exclusive of depreciation induded in...
For Target in 2018, what were Capital Expenditures? Round to
nearest $mm and use the $ symbol (e.g $3,234 would be a correct
form). Do not use parentheses or negative symbols.
2017 2018 As Adjusted As Adjusted 2016 (millions, except per share data) S Sales 74,433 71,786 69,414 Other revenue 923 928 857 Total revenue 75,356 70,271 72,714 Cost of sales 53,299 51,125 49,145 Selling, general and administrative expenses 15,723 15,140 14,217 Depreciation and amortization (exclusive of depreciation induded in...
 Compute ROA, Profit Margin, and Asset Turnover Refer to the financial information for Target Corporation, presented below: Target Corporation Balance Sheets January 31, February 1, ($ millions) 2015 2014 Assets Cash and cash equivalents $2,210 $670 Inventory 8,790 8,278 Other current assets 3,087 2,625 Total current assets 14,087 11,573 Property and equipment, net 25,958 26,412 Other noncurrent assets 1,359 6,568 Total assets $41,404 $44,553 Liabilities and shareholders' investment 59 Accounts payable Accrued and other current liabilities Current portion of long-term...
 2015 Analysis and Interpretation of Liquidity and Solvency Refer to the financial information for Target Corporation (TGT), presented below, to answer the following. Target Corporation Balance Sheets January 31, February 1, ($ millions) 2014 Assets Cash and cash equivalents $2,210 $670 Inventory 8,790 8,278 Other current assets 3,087 2,625 Total current assets 14,087 11,573 Property and equipment, net 25,958 26,412 Other noncurrent assets 1,359 6,568 Total assets $41,404 $44,553 Liabilities and shareholders' investment Accounts payable $7,759 $7,335 Accrued and other...
 Common-Size Balance Sheets Following is the balance sheet for Target Corporation. Prepare Target's common-size balance sheets as of January 31, 2015 and February 1, 2014 (Round your answers to one decimal place.) January 31, February 1, (5 millions) 2015 2014 Assets Cash and cash equivalents 52.210 5670 Inventory 8.790 Other current assets 2.625 Total current assets 14,087 11,573 Property and equipment, net 25,958 26,412 Other noncurrent assets 1,359 6,568 Total assets $41,404 $44,553 Liabilities and shareholders' investment Accounts payable 57,759...
 % 100.00% % 100,00% Vertical Analysis - Income Statement Target Corporation INSTRUCTIONS Change XX to the year of the report you are analyzing. You may have to insert additional rows FY 2010 3 hed on the actual Target Consolidated statement 4 Sales $ 74,433 Cost of sales 53,299 Gross margin $ 21,134 7 Selling, general, and administrative expenses Depreciation and amortization 2.224 9 Gain on sale 10 Earnings from continuing operations before interest and taxes $ 3,187 11 Net interest...
 February 2. January 21 2018 2017 52.643 8652 1.264 12.564 25.018 1.417 538.999 52.512 8309 1.169 11.990 24,658 783 (5 millions) Assets Cash and cash equivalents Inventory Other current assets Total current assets Property and equipment, net Other noncurrent assets Total assets Liabilities and shareholders' investment Accounts payable Accrued and other current lite Current portion of long term debt and notes payable Total current liabilities Long-term debit Deferred income taxes Other noncurrent liabilities Total shareholders Investment Total liabilities and shareholders'...
 P4-29. Compute and Interpret Liquidity, Solvency, and Coverage Ratios Information from the balance sheet, income statement, and statement of cash flows for Lockheed Martin Corporation follow. Refer to these financial statements to answer the requirements. 2016 2015 $40,365 6,883 $34,868 5,668 40,536 47,248 (36,616) (6,040) (31,091) (4,824) (82) LOCKHEED MARTIN CORPORATION Consolidated Statements of Earnings Year Ended December 31 (in millions) Net sales Products.. Services .... Total net sales ........ Cost of sales Products ..... Services Severance charges.. Other unallocated,...
 Problem 2
On the following page, I have attached PG Company’s Consolidated
Statements of Earnings for the 3 fiscal year’s ending June 30,
2019.
Required:Using the attached earnings statement, for each period
presented,
Compute the gross margin %
Note: Gross margin % = [(Net sales –
Cost of products sold)/Net sales] x 100
Compute the net profit margin on sales %
Note: Net profit margin % = (Net
earnings attributable to PG/Net sales) x 100
Considering the 3-year trend for...
Problem 2
On the following page, I have attached PG Company’s Consolidated
Statements of Earnings for the 3 fiscal year’s ending June 30,
2019.
Required:Using the attached earnings statement, for each period
presented,
Compute the gross margin %
Note: Gross margin % = [(Net sales –
Cost of products sold)/Net sales] x 100
Compute the net profit margin on sales %
Note: Net profit margin % = (Net
earnings attributable to PG/Net sales) x 100
Considering the 3-year trend for...
Most questions answered within 3 hours.
-
A 1.3 eV electron has a 10-4 probability of tunneling
through a 2.4 eV potential barrier....
asked 5 minutes ago -
What is the one ingredient that is common to being successful
with all stakeholders?
profit
trust...
asked 4 minutes ago -
Write an assembly language 32 bit program that reads in lines of
text by a .txt...
asked 6 minutes ago -
what is the density ( in g/L) of hydrogen gas at 29 degrees C and a...
asked 15 minutes ago -
5-6. You are considering three investment alternatives for some
spare cash: Old Reliable Corporation stock (A1),...
asked 7 minutes ago -
Problem 16-02
Receivables Investment
Medwig Corporation has a DSO of 45 days. The company averages
$7,250...
asked 22 minutes ago -
Mr. Brown hired Lowe's Maintenance Services Limited to repair
and paint the exterior wall of his...
asked 22 minutes ago -
When might an index slow down the overall performance of the
database? Choose the best answer....
asked 27 minutes ago -
Due to a recession, expected inflation this year is only 2.25%.
However, the inflation rate in...
asked 29 minutes ago -
Write four functions: (IN PYTHON 3)
1) bound(l) - given a list of integers l, compute...
asked 31 minutes ago -
A quarterback throws a football. When the football leaves his
hand, it has a horizontal velocity...
asked 39 minutes ago -
he term "reproductive isolation mechanism" refers to
inability of a species to continue reproduction
specific areas...
asked 41 minutes ago