


2015 5 52,241 Consolidated Statements of Operations 2016 2017 71,879 $ 69,495 73,78 Sales Cost of sales Gross margin Seling, general and administrative expenses 49,145 20,754 20,350 14,248 13,356 2,025 51,125 21,544 14,665 1,969 620 of sales)and amortization (exclusive of depreciation included in cost 2,194 Gain on sale mings from continuing operations before interest expense and income 4,969 1,004 3,965 1,296 2,669 68 5,530 607 4,923 1,602 3,321 42 737 $ 3,363 taxes 4,312 Net interest expense Earnings from continuing operations before income taxes Not earnings from continuing operations Net earnings 3,646 718 2,928 Provision for income taxes 2934 S Basic earnings per share Continuing operations Discontinued operations S 5.35 S 4.62 $ 5.29 0.07 5.35 0.01 5.36 $ Net earnings per share Diluted earnings per share 4.74 $ Continuing operations Discontinued operations Net earnings per share $ 5.32 S 4.58 S 5.25 0.07 5.31 0.01 5.33 0.12 4.70 S Weighted average common shares outstanding Basic Dilutive effect of share-based awards Diluted 546.8577.6627.7 5.2 632.9 3.5 Antidilutive shares 0.1 Dividends declared per share $ 2.46 $ 2.20 Note: Per share amounts may not foot due to rounding Refer to Note 3 for additional information about a reclassification of supply chain-related depreciation expense to Cost of Sales See accompanying Notes to Consolidated Financial Statements
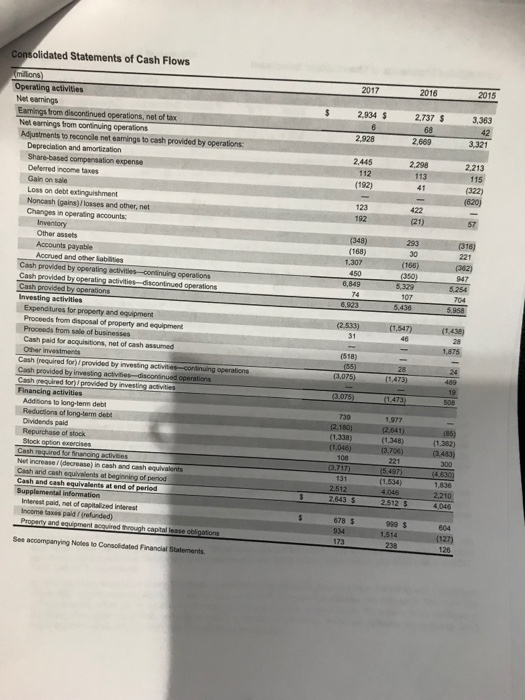
h Consolidated Statements of Cash Flows 2017 2016 2015 2,934 $ 3,363 3.321 2,213 2,737 $ Earnings from discontinued operations, net of tax Net earnings from continuing operations Adjustments to reconoile net eamings to cash provided by operations: 68 2.669 2,928 Depreciation and amortization 2.445 112 2,298 113 115 Delerred income taxes 192) Gain on sale Loss on debt extinguishment Noncash (gains)/losses and other, net Changes in operating accounts: (348) (168) (316) 221 Other assets Accounts payable Accrued and oher lablities 30 (165) 450 6,849 947 by operatingact ,958 (2533) (1547)(1,438) 1,875 436 Investing activities s for property and equipment Proceeds from disposal of property and equipment Cash paid for acquisitions, net of cash assumed Cash (required for)/ provided by investing ac 31 46 28 Financing activities Addsions to long-term debt Dividends paid Repurchase of stock Stock eption ex 739 2.180) (1.338) (1,046) 1,977 2.641) (1,348) 3,706) (3.483) (1,382) of period equlvalents at and of periesd 2,512 2.643 2,210 4,046 Interest paid, net of capitalized interest Income taxes paid/(refunded) 678 $ 9e9 S 1,514 (127) ee accompanying Notes to Consolidated Financial Statements
What were the important changes? Compare balance sheets for the last two years. What were the important changes? Look at the cash flow statements for the last three years to evaluate what they tell you about why the balance sheet changed and about how the companies decided to use their cash. What were the significant items on the cash flow statements? Does the company have a liquidity problem?
Homework Answers
By comparing Income Statement and balance sheet of last two years findings are :
- Cost of sales has increased from 70% to 71% thus reduced gross profit.
- Marginal increase in Selling Expenses also impact the earnings
- Interest Expense has been decreased significantly (Almost Half) as compared to last year
- Capital Work in progress is increased by 220 millions.
- Company has spent amount on buildings as well they have increased compared to last year.
- There is 20% increase in Accounts payable which results into lower cash to cash cycle
- Debt Maturing in coming year i.e current portion of long term debt is very low compared to previous year.
Analysis of Cash Flow
- Company is earnings positive cash flow from operations which is a good sign.
- Cash flow from operations is mainly increased due to non payment to creditors thus Accounts payable increased significantly in balance sheet.
- In investing activities major portion is spent for property and equipment which is clearly shown from the increased value of capital work in progress and buildings value.
- In Financing Activity company has paid long term debt that is why current portion of long term debt is reduced in balance sheet.
- After all payments and investment company is still have positive cash flows.
Yes Company is facing a liquidity Issue as inventory is not part of liquid ratio and company does not have enough cash to pay its creditors.
Add Answer to:
Compare income statment and balance sheet for the last two years any changes? analyize cash flow ...
Instead of “cash,” the company’s balance sheet uses the account name “Cash and cash equivalents.” How...
 Instead of “cash,” the company’s balance sheet uses the account
name “Cash and cash equivalents.” How does the company define cash
equivalents?
The annual report has two reports in which management is
clearly identified as having for the company’s financial reporting
and internal controls. What are the names of these reports and on
what pages are they located?
For the Fiscal Year 2017 2016 As Adjusted As Adjusted 71,786 $ 69,414 $ 72,714 70,271 2014 2018 74,433 $ 75,356 $...
Instead of “cash,” the company’s balance sheet uses the account
name “Cash and cash equivalents.” How does the company define cash
equivalents?
The annual report has two reports in which management is
clearly identified as having for the company’s financial reporting
and internal controls. What are the names of these reports and on
what pages are they located?
For the Fiscal Year 2017 2016 As Adjusted As Adjusted 71,786 $ 69,414 $ 72,714 70,271 2014 2018 74,433 $ 75,356 $...
P4-29. Compute and Interpret Liquidity, Solvency, and Coverage Ratios Information from the balance sheet, income statement,...
 P4-29. Compute and Interpret Liquidity, Solvency, and Coverage Ratios Information from the balance sheet, income statement, and statement of cash flows for Lockheed Martin Corporation follow. Refer to these financial statements to answer the requirements. 2016 2015 $40,365 6,883 $34,868 5,668 40,536 47,248 (36,616) (6,040) (31,091) (4,824) (82) LOCKHEED MARTIN CORPORATION Consolidated Statements of Earnings Year Ended December 31 (in millions) Net sales Products.. Services .... Total net sales ........ Cost of sales Products ..... Services Severance charges.. Other unallocated,...
Balance Sheet Ratios for 2004 and 2005 Look closely at the Consolidated Condensed Statement of Cash...
 Balance Sheet Ratios for 2004
and 2005
Look closely at the Consolidated Condensed Statement of
Cash Flows from 2005 and comment on what Financing Activity
occurred to cause the negative Book Equity.
Is the Book Debt to Equity Ratio meaningful in
2005?
Would the Market to Book Ratio be meaningful in
2005?
Does the Negative Book Equity mean the
company is worthless to its shareholders in 2005? Explain your
answer.
Yours ended June 30 (dollars in milions, except per share...
Balance Sheet Ratios for 2004
and 2005
Look closely at the Consolidated Condensed Statement of
Cash Flows from 2005 and comment on what Financing Activity
occurred to cause the negative Book Equity.
Is the Book Debt to Equity Ratio meaningful in
2005?
Would the Market to Book Ratio be meaningful in
2005?
Does the Negative Book Equity mean the
company is worthless to its shareholders in 2005? Explain your
answer.
Yours ended June 30 (dollars in milions, except per share...
Calculate the altman Z-score that is the question 12. Calculate the market-to-book ratio of the company...
 Calculate the altman Z-score that is the question
12. Calculate the market-to-book ratio of the company as of Feb 2, 2019. This is the Feb 2, 2019 market capitalization of the stock divided by the latest book value of shareholders' equity. Target's stock closed at $68.97 per share on the last trading day of the fiscal year, which was Feb 1, 2019. Shane price X share 2. Bankruptcy Risk. Calculate the Altman Z-Score as of the 2018 balance sheet date....
Calculate the altman Z-score that is the question
12. Calculate the market-to-book ratio of the company as of Feb 2, 2019. This is the Feb 2, 2019 market capitalization of the stock divided by the latest book value of shareholders' equity. Target's stock closed at $68.97 per share on the last trading day of the fiscal year, which was Feb 1, 2019. Shane price X share 2. Bankruptcy Risk. Calculate the Altman Z-Score as of the 2018 balance sheet date....
Problem 2 On the following page, I have attached PG Company’s Consolidated Statements of Earnings for...
 Problem 2
On the following page, I have attached PG Company’s Consolidated
Statements of Earnings for the 3 fiscal year’s ending June 30,
2019.
Required:Using the attached earnings statement, for each period
presented,
Compute the gross margin %
Note: Gross margin % = [(Net sales –
Cost of products sold)/Net sales] x 100
Compute the net profit margin on sales %
Note: Net profit margin % = (Net
earnings attributable to PG/Net sales) x 100
Considering the 3-year trend for...
Problem 2
On the following page, I have attached PG Company’s Consolidated
Statements of Earnings for the 3 fiscal year’s ending June 30,
2019.
Required:Using the attached earnings statement, for each period
presented,
Compute the gross margin %
Note: Gross margin % = [(Net sales –
Cost of products sold)/Net sales] x 100
Compute the net profit margin on sales %
Note: Net profit margin % = (Net
earnings attributable to PG/Net sales) x 100
Considering the 3-year trend for...
Determine the Net Purchases of your company. Show and label your work. Use the following formula:...
 Determine the Net Purchases of your company. Show and label
your work. Use the following formula: Beginning Inventory + Net
Purchases = Ending Inventory + COGS. Hint: Remember, the prior
year’s ending inventory is the current year’s beginning
inventory.
Beginning inventory=
Net purchases=
Calculate your company’s Historical Gross Profit Rate. Show and
label your work! Use the following formula: Gross Profit from Prior
Periods / Net Sales from Prior Periods.
Using the information calculated in “d” and “e” above,
calculate...
Determine the Net Purchases of your company. Show and label
your work. Use the following formula: Beginning Inventory + Net
Purchases = Ending Inventory + COGS. Hint: Remember, the prior
year’s ending inventory is the current year’s beginning
inventory.
Beginning inventory=
Net purchases=
Calculate your company’s Historical Gross Profit Rate. Show and
label your work! Use the following formula: Gross Profit from Prior
Periods / Net Sales from Prior Periods.
Using the information calculated in “d” and “e” above,
calculate...
Balance Sheet Ratios for 2004 and 2005 Calculate the Current Ratio Calculate the Book Debt to...
 Balance Sheet Ratios for 2004 and 2005
Calculate the Current Ratio
Calculate the Book Debt to Equity Ratio
Calculate the Market Debt to Equity Ratio (Use Book
Value of Debt and Market Capitalization using basic shares
outstanding and assuming stock prices of $56.89/share in 2005 and
$58.93/share in 2004.)
Calculate the Enterprise Value of Clorox using the
Market Capitalization from above.
Yours ended June 30 (dollars in milions, except per share amounts) 2005 2004 2003 $ Net sales Cost of...
Balance Sheet Ratios for 2004 and 2005
Calculate the Current Ratio
Calculate the Book Debt to Equity Ratio
Calculate the Market Debt to Equity Ratio (Use Book
Value of Debt and Market Capitalization using basic shares
outstanding and assuming stock prices of $56.89/share in 2005 and
$58.93/share in 2004.)
Calculate the Enterprise Value of Clorox using the
Market Capitalization from above.
Yours ended June 30 (dollars in milions, except per share amounts) 2005 2004 2003 $ Net sales Cost of...
Use the financial statements of Clorox to answer the following question: Profitability Ratios for 2003, 2004...
 Use the financial statements of Clorox to answer the
following question:
Profitability Ratios for 2003, 2004 and
2005
Calculate the Gross Margin (Use Gross
Profit)
Calculate the Operating Margin (Use the Earnings from
Continuing Operations before income taxes)
Calculate the Net Profit Margin (Use Net
Earnings)
Comment on the profitability trends in their
business.
16 The Clorox Company Report of Independent Registered Public Accounting Firm on Condensed Consolidated Financial Statements The Board of Directors and Stockholders of The Clorox Company:...
Use the financial statements of Clorox to answer the
following question:
Profitability Ratios for 2003, 2004 and
2005
Calculate the Gross Margin (Use Gross
Profit)
Calculate the Operating Margin (Use the Earnings from
Continuing Operations before income taxes)
Calculate the Net Profit Margin (Use Net
Earnings)
Comment on the profitability trends in their
business.
16 The Clorox Company Report of Independent Registered Public Accounting Firm on Condensed Consolidated Financial Statements The Board of Directors and Stockholders of The Clorox Company:...
Based on the information contained in these financial statements, compute free cash flow for Amazon at...
 Based on the information contained in these financial
statements, compute free cash flow for Amazon at December 31, 2016
and Wal-Mart for January 31, 2017. What conclusions concerning the
management of cash can be drawn from free cash flow for each
company?
AMAZON.COM, INC. CONSOLIDATED STATEMENTS OF CASH FLOWS in millions) Year Ended December 31, 2014 2015 2016 $ 8,658 $ 14.557 $ 15,890 (241) 596 2,371 4.746 1,497 129 6,281 2,119 155 250 8,116 2,975 160 (20) (246) (829)...
Based on the information contained in these financial
statements, compute free cash flow for Amazon at December 31, 2016
and Wal-Mart for January 31, 2017. What conclusions concerning the
management of cash can be drawn from free cash flow for each
company?
AMAZON.COM, INC. CONSOLIDATED STATEMENTS OF CASH FLOWS in millions) Year Ended December 31, 2014 2015 2016 $ 8,658 $ 14.557 $ 15,890 (241) 596 2,371 4.746 1,497 129 6,281 2,119 155 250 8,116 2,975 160 (20) (246) (829)...
use the income and balance sheet above to answer the questions below. (please show work, id...
 use the income and balance sheet above to answer the questions
below. (please show work, id appreciate it)
Done Coco Cola Income and Balance Sheet (4 of 11) 12 Months Ended CONSOLIDATED STATEMENTS OF INCOME-USD (S)shares in Millioas, S in Millions Dec. 31, 2018 Dec. 31, 2017 Dec. 31, 2016Dee.3,2015 Dec. 31, 2014 Dec. 31, 2013 31856 35410 3255 41863 16465 Cost of Goods and Services Sold GROSS PROFIT Selling, General and Administrative Expense Other Cost and Expense, Operating OPERATING...
use the income and balance sheet above to answer the questions
below. (please show work, id appreciate it)
Done Coco Cola Income and Balance Sheet (4 of 11) 12 Months Ended CONSOLIDATED STATEMENTS OF INCOME-USD (S)shares in Millioas, S in Millions Dec. 31, 2018 Dec. 31, 2017 Dec. 31, 2016Dee.3,2015 Dec. 31, 2014 Dec. 31, 2013 31856 35410 3255 41863 16465 Cost of Goods and Services Sold GROSS PROFIT Selling, General and Administrative Expense Other Cost and Expense, Operating OPERATING...
 Instead of “cash,” the company’s balance sheet uses the account
name “Cash and cash equivalents.” How does the company define cash
equivalents?
The annual report has two reports in which management is
clearly identified as having for the company’s financial reporting
and internal controls. What are the names of these reports and on
what pages are they located?
For the Fiscal Year 2017 2016 As Adjusted As Adjusted 71,786 $ 69,414 $ 72,714 70,271 2014 2018 74,433 $ 75,356 $...
Instead of “cash,” the company’s balance sheet uses the account
name “Cash and cash equivalents.” How does the company define cash
equivalents?
The annual report has two reports in which management is
clearly identified as having for the company’s financial reporting
and internal controls. What are the names of these reports and on
what pages are they located?
For the Fiscal Year 2017 2016 As Adjusted As Adjusted 71,786 $ 69,414 $ 72,714 70,271 2014 2018 74,433 $ 75,356 $...
 P4-29. Compute and Interpret Liquidity, Solvency, and Coverage Ratios Information from the balance sheet, income statement, and statement of cash flows for Lockheed Martin Corporation follow. Refer to these financial statements to answer the requirements. 2016 2015 $40,365 6,883 $34,868 5,668 40,536 47,248 (36,616) (6,040) (31,091) (4,824) (82) LOCKHEED MARTIN CORPORATION Consolidated Statements of Earnings Year Ended December 31 (in millions) Net sales Products.. Services .... Total net sales ........ Cost of sales Products ..... Services Severance charges.. Other unallocated,...
 Balance Sheet Ratios for 2004
and 2005
Look closely at the Consolidated Condensed Statement of
Cash Flows from 2005 and comment on what Financing Activity
occurred to cause the negative Book Equity.
Is the Book Debt to Equity Ratio meaningful in
2005?
Would the Market to Book Ratio be meaningful in
2005?
Does the Negative Book Equity mean the
company is worthless to its shareholders in 2005? Explain your
answer.
Yours ended June 30 (dollars in milions, except per share...
Balance Sheet Ratios for 2004
and 2005
Look closely at the Consolidated Condensed Statement of
Cash Flows from 2005 and comment on what Financing Activity
occurred to cause the negative Book Equity.
Is the Book Debt to Equity Ratio meaningful in
2005?
Would the Market to Book Ratio be meaningful in
2005?
Does the Negative Book Equity mean the
company is worthless to its shareholders in 2005? Explain your
answer.
Yours ended June 30 (dollars in milions, except per share...
 Calculate the altman Z-score that is the question
12. Calculate the market-to-book ratio of the company as of Feb 2, 2019. This is the Feb 2, 2019 market capitalization of the stock divided by the latest book value of shareholders' equity. Target's stock closed at $68.97 per share on the last trading day of the fiscal year, which was Feb 1, 2019. Shane price X share 2. Bankruptcy Risk. Calculate the Altman Z-Score as of the 2018 balance sheet date....
Calculate the altman Z-score that is the question
12. Calculate the market-to-book ratio of the company as of Feb 2, 2019. This is the Feb 2, 2019 market capitalization of the stock divided by the latest book value of shareholders' equity. Target's stock closed at $68.97 per share on the last trading day of the fiscal year, which was Feb 1, 2019. Shane price X share 2. Bankruptcy Risk. Calculate the Altman Z-Score as of the 2018 balance sheet date....
 Problem 2
On the following page, I have attached PG Company’s Consolidated
Statements of Earnings for the 3 fiscal year’s ending June 30,
2019.
Required:Using the attached earnings statement, for each period
presented,
Compute the gross margin %
Note: Gross margin % = [(Net sales –
Cost of products sold)/Net sales] x 100
Compute the net profit margin on sales %
Note: Net profit margin % = (Net
earnings attributable to PG/Net sales) x 100
Considering the 3-year trend for...
Problem 2
On the following page, I have attached PG Company’s Consolidated
Statements of Earnings for the 3 fiscal year’s ending June 30,
2019.
Required:Using the attached earnings statement, for each period
presented,
Compute the gross margin %
Note: Gross margin % = [(Net sales –
Cost of products sold)/Net sales] x 100
Compute the net profit margin on sales %
Note: Net profit margin % = (Net
earnings attributable to PG/Net sales) x 100
Considering the 3-year trend for...
 Determine the Net Purchases of your company. Show and label
your work. Use the following formula: Beginning Inventory + Net
Purchases = Ending Inventory + COGS. Hint: Remember, the prior
year’s ending inventory is the current year’s beginning
inventory.
Beginning inventory=
Net purchases=
Calculate your company’s Historical Gross Profit Rate. Show and
label your work! Use the following formula: Gross Profit from Prior
Periods / Net Sales from Prior Periods.
Using the information calculated in “d” and “e” above,
calculate...
Determine the Net Purchases of your company. Show and label
your work. Use the following formula: Beginning Inventory + Net
Purchases = Ending Inventory + COGS. Hint: Remember, the prior
year’s ending inventory is the current year’s beginning
inventory.
Beginning inventory=
Net purchases=
Calculate your company’s Historical Gross Profit Rate. Show and
label your work! Use the following formula: Gross Profit from Prior
Periods / Net Sales from Prior Periods.
Using the information calculated in “d” and “e” above,
calculate...
 Balance Sheet Ratios for 2004 and 2005
Calculate the Current Ratio
Calculate the Book Debt to Equity Ratio
Calculate the Market Debt to Equity Ratio (Use Book
Value of Debt and Market Capitalization using basic shares
outstanding and assuming stock prices of $56.89/share in 2005 and
$58.93/share in 2004.)
Calculate the Enterprise Value of Clorox using the
Market Capitalization from above.
Yours ended June 30 (dollars in milions, except per share amounts) 2005 2004 2003 $ Net sales Cost of...
Balance Sheet Ratios for 2004 and 2005
Calculate the Current Ratio
Calculate the Book Debt to Equity Ratio
Calculate the Market Debt to Equity Ratio (Use Book
Value of Debt and Market Capitalization using basic shares
outstanding and assuming stock prices of $56.89/share in 2005 and
$58.93/share in 2004.)
Calculate the Enterprise Value of Clorox using the
Market Capitalization from above.
Yours ended June 30 (dollars in milions, except per share amounts) 2005 2004 2003 $ Net sales Cost of...
 Use the financial statements of Clorox to answer the
following question:
Profitability Ratios for 2003, 2004 and
2005
Calculate the Gross Margin (Use Gross
Profit)
Calculate the Operating Margin (Use the Earnings from
Continuing Operations before income taxes)
Calculate the Net Profit Margin (Use Net
Earnings)
Comment on the profitability trends in their
business.
16 The Clorox Company Report of Independent Registered Public Accounting Firm on Condensed Consolidated Financial Statements The Board of Directors and Stockholders of The Clorox Company:...
Use the financial statements of Clorox to answer the
following question:
Profitability Ratios for 2003, 2004 and
2005
Calculate the Gross Margin (Use Gross
Profit)
Calculate the Operating Margin (Use the Earnings from
Continuing Operations before income taxes)
Calculate the Net Profit Margin (Use Net
Earnings)
Comment on the profitability trends in their
business.
16 The Clorox Company Report of Independent Registered Public Accounting Firm on Condensed Consolidated Financial Statements The Board of Directors and Stockholders of The Clorox Company:...
 Based on the information contained in these financial
statements, compute free cash flow for Amazon at December 31, 2016
and Wal-Mart for January 31, 2017. What conclusions concerning the
management of cash can be drawn from free cash flow for each
company?
AMAZON.COM, INC. CONSOLIDATED STATEMENTS OF CASH FLOWS in millions) Year Ended December 31, 2014 2015 2016 $ 8,658 $ 14.557 $ 15,890 (241) 596 2,371 4.746 1,497 129 6,281 2,119 155 250 8,116 2,975 160 (20) (246) (829)...
Based on the information contained in these financial
statements, compute free cash flow for Amazon at December 31, 2016
and Wal-Mart for January 31, 2017. What conclusions concerning the
management of cash can be drawn from free cash flow for each
company?
AMAZON.COM, INC. CONSOLIDATED STATEMENTS OF CASH FLOWS in millions) Year Ended December 31, 2014 2015 2016 $ 8,658 $ 14.557 $ 15,890 (241) 596 2,371 4.746 1,497 129 6,281 2,119 155 250 8,116 2,975 160 (20) (246) (829)...
 use the income and balance sheet above to answer the questions
below. (please show work, id appreciate it)
Done Coco Cola Income and Balance Sheet (4 of 11) 12 Months Ended CONSOLIDATED STATEMENTS OF INCOME-USD (S)shares in Millioas, S in Millions Dec. 31, 2018 Dec. 31, 2017 Dec. 31, 2016Dee.3,2015 Dec. 31, 2014 Dec. 31, 2013 31856 35410 3255 41863 16465 Cost of Goods and Services Sold GROSS PROFIT Selling, General and Administrative Expense Other Cost and Expense, Operating OPERATING...
use the income and balance sheet above to answer the questions
below. (please show work, id appreciate it)
Done Coco Cola Income and Balance Sheet (4 of 11) 12 Months Ended CONSOLIDATED STATEMENTS OF INCOME-USD (S)shares in Millioas, S in Millions Dec. 31, 2018 Dec. 31, 2017 Dec. 31, 2016Dee.3,2015 Dec. 31, 2014 Dec. 31, 2013 31856 35410 3255 41863 16465 Cost of Goods and Services Sold GROSS PROFIT Selling, General and Administrative Expense Other Cost and Expense, Operating OPERATING...
Most questions answered within 3 hours.
-
1.In the context of chelation, what does binding strength mean?
What happens at the molecular level...
asked 1 minute ago -
Describe two obstacles that makes fixing atmospheric nitrogen
difficult.
asked 20 minutes ago -
Evelyn incorporates her sole proprietorship, transferring it to
newly formed Papaya Corporation. The assets transferred have...
asked 6 minutes ago -
Assume that in a hydrogen atom, the electron circles the nucleus
in a circle of radius...
asked 15 minutes ago -
A
752 mL sample of water was placed in a 1000 gram pan of aluminum.
The...
asked 8 minutes ago -
1 point) Given the significance level α=0.01 find the following:
(a) left-tailed z value z= (b)...
asked 9 minutes ago -
Calculate the expected value, the variance, and the standard
deviation of the given random variable X....
asked 11 minutes ago -
T
F 53) Most differences
between human groups are the result of biology rather than
culture....
asked 24 minutes ago -
A 5.20 mW helium neon laser emits a visible laser beam with a
wavelength of 633...
asked 27 minutes ago -
Assignment:
Your
organization has made a strategic decision
to
outsourcework
currently performed in house. You have...
asked 26 minutes ago -
A hospital performs 100 surgeries per week. The probability that
complications after surgery occur is 10%....
asked 27 minutes ago -
In preparing its cash flow statement for the year ended December
31, 2018, Green Co. gathered...
asked 28 minutes ago