
Homework Answers
Answer #1
Solution
SOLUTION (a) The sampling method is independent, because the samples were randomly selected from independent populations. (b) To use the two-sample t-test, we require that the sampling distributions of the sample mean are approximately normal. Since the samples are small, the central limit theorem cannot be used. The sampling distribution of the sample mean is then approximately normal if the population distribution is approximately normal. Thus we need to assume that the population distributions of both populations) are approximately normal.
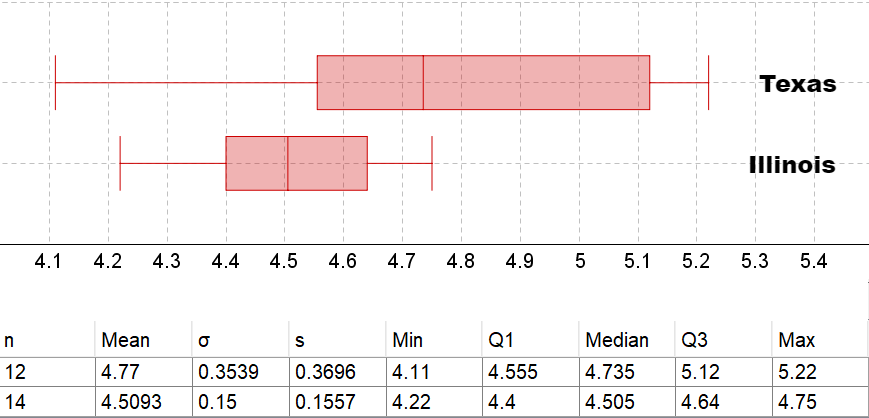
Texas Illinois 4.1 4.2 4.3 4.4 4.5 4.6 4.7 4.8 4.9 07 5.1 5.2 5.3 5.4 n Mean S Q1 Q3 Max 12 o 0.3539 0.15 4.77 4.5093 4.555 Min 4.11 4.22 0.3696 0.1557 5.12 Median 4.735 4.505 5.22 4.75 14 4.4 4.64
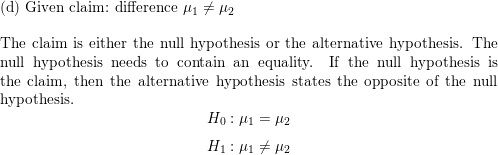
(d) Given claim: difference H1 H2 The claim is either the null hypothesis or the alternative hypothesis. The null hypothesis needs to contain an equality. If the null hypothesis is the claim, then the alternative hypothesis states the opposite of the null hypothesis. HO: M1 = 42 H: Mi + H2
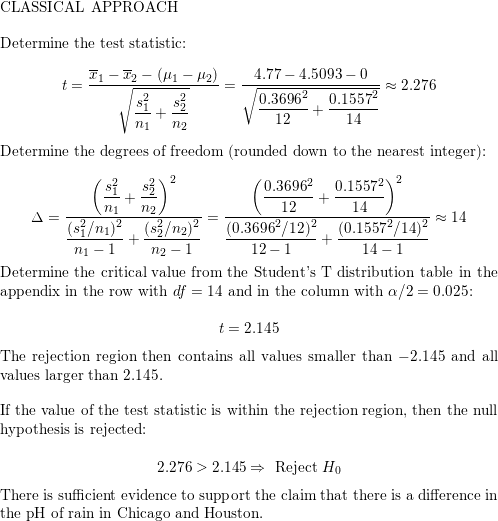
CLASSICAL APPROACH Determine the test statistic: ta 71 - T2 - (11-12) si 2.276 4.77 – 4.5093-0 0.36962 0.15572 12 14 + ni n2 2 ܒ݁ܪܺܝܐ = + 11 n2 Determine the degrees of freedom (rounded down to the nearest integer): si s 0.36962 0.15572 12 14 14 (si/ni)? (sz/n2) (0.3696-/12) (0.15574/14)? ni 12-1 14-1 Determine the critical value from the Student's T distribution table in the appendix in the row with df = 14 and in the column with a/2 = 0.025: 1 n2-1 t = 2.145 The rejection region then contains all values smaller than -2.145 and all values larger than 2.145. If the value of the test statistic is within the rejection region, then the null hypothesis is rejected: 2.276 > 2.145 = Reject Ho There is sufficient evidence to support the claim that there is a difference in the pH of rain in Chicago and Houston.
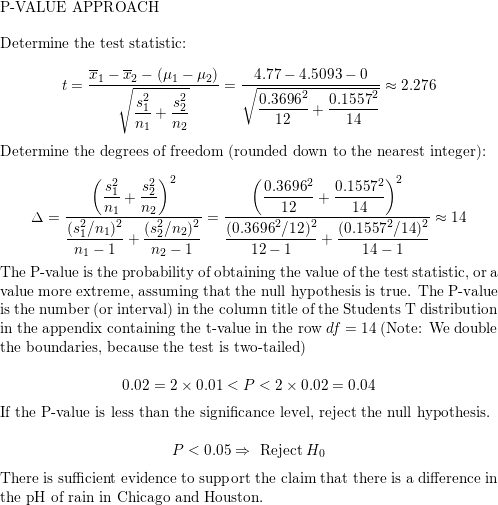
P-VALUE APPROACH Determine the test statistic: t- 71 - T2 - (11-12) si 2.276 4.77 – 4.5093-0 0.36962 0.15572 12 14 + ni n2 2 + 11 n2 Determine the degrees of freedom (rounded down to the nearest integer): si s 0.36962 0.15572 12 14 14 (s/n)(s/n2) (0.3696-/12) (0.15574/14) 1 12-1 14-1 The P-value is the probability of obtaining the value of the test statistic, or a value more extreme, assuming that the null hypothesis is true. The P-value is the number or interval) in the column title of the Students T distribution in the appendix containing the t-value in the row df = 14 (Note: We double the boundaries, because the test is two-tailed) ni n2-1 0.02 = 2 x 0.01 <P < 2 x 0.02 = 0.04 If the P-value is less than the significance level, reject the null hypothesis. P<0.05 → Reject Ho There is sufficient evidence to support the claim that there is a difference in the pH of rain in Chicago and Houston.
Know the answer?
Add Answer to:
7. A researcher wants to know whether the acidity of rain (pH) near Houston, Texas, is...
Not the answer you're looking for?
Ask your own homework help question.
Our experts will answer your question WITHIN MINUTES for Free.
Similar Homework Help Questions
ADVERTISEMENT
Need Online Homework Help?
Ask
a QuestionGet Answers For Free
Most questions answered within 3 hours.
Most questions answered within 3 hours.
ADVERTISEMENT
ADVERTISEMENT
Active Questions
-
Look at sample problem 19.6 in the 8th ed Silberberg book.
Enter your answers in scientific...
asked 6 minutes ago -
A long straight wire carries a current of 5.00 A at a distance r from the...
asked 8 minutes ago -
A 125
g baseball is thrown at a speed of 127ft/sec at a batter, the ball...
asked 13 minutes ago -
If you have an eta squared of .34 and used a
between-subjects design, what does that...
asked 21 minutes ago -
*Healthcare Adminstration*
Scutchfield and Keck's Principles of Public Health Practice
4th edition
What are the differences...
asked 25 minutes ago -
Find the complete optimal solution to this linear programming
problem. Max 5x + 3y s.t. 2x...
asked 53 minutes ago -
The pH of an acetate buffer was determined to be 4.76. Then, a
few drops of...
asked 56 minutes ago -
a sample of size 1500 is used to find a confidence
interval for the percentage of...
asked 1 hour ago -
Explain in detail the differences between qualitative and
quantitative forecasts. Include at least two examples of...
asked 1 hour ago -
Differentiate between response time and throughput.
Explain how the physical design of a database influences
performance...
asked 1 hour ago -
Write MATLAB code to plot the following
waveforms.
Rectangular pulses:
????(?)
????(? − ?)
????(?/?) ...
asked 1 hour ago -
4. Adam’s Inc.’s outstanding common stock is currently selling
in the market for $28. Dividends of...
asked 1 hour ago
ADVERTISEMENT