Question 4 - Supply and Demand Assume that the demand and the supply in a market...
Question 4 - Supply and Demand
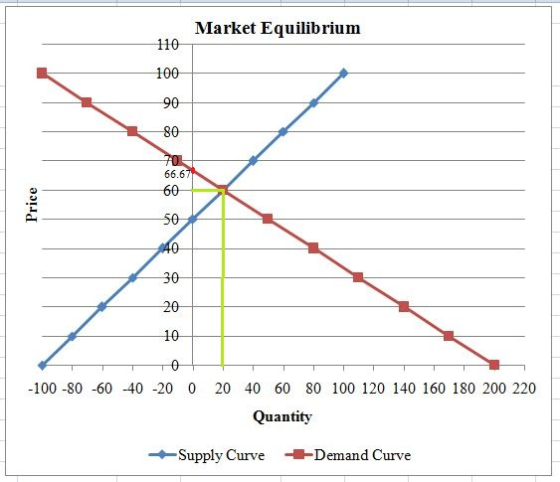
Assume that the demand and the supply in a market are represented by the following equations:
Qd = 200- 3P
Qs = 2P - 100
(i) Compute and illustrate (i.e. show with a graph – make sure it is labeled) the market equilibrium in this case.
(ii) Find the CS and PS in the market and interpret what the values mean.
Homework Answers
Answer:
Given,
Qd = 200- 3P
Qs = 2P - 100
(i) Thus the condition of market equilibrium is Qd=Qs=>200- 3P=2P - 100=>5P=300=>P=60
Hence the equilibrium price, P=60 and the equilibrium quantity, Q=200- 3P=200-3*60=200-180=20
(ii) CS and PS:
CS=0.5*(66.67-60)*20=66.7
and PS=0.5*(60-50)*20=100
Meaning: CS=66.7 indicates that at price=60 the consumer buys 20 quantity for which he/she is willing and can pay more up to the amount of 66.7. Similarly, PS=100 indicates that the producer also in surplus of 100 selling at price of 60 i.e. the producer is gaining more than he/she is actually want.
Add Answer to:
Question 4 - Supply and Demand
Assume that the demand and the supply in a market...
The market demand and supply is described by the following equations QD = 250 - 2P QS 3P 1) Find the market equilibrium...
 The market demand and supply is described by the following equations QD = 250 - 2P QS 3P 1) Find the market equilibrium. 2) What is the CS, PS, and W in this market? 3) Assume that the government introduces a equilibrium? price ceiling of p = 15. What is the new 4) Find the change in CS, PS, and W. Is there Dead Weight Loss? if so, of how much? 5) What does this tell you about the welfare...
1. Numerical analysis of supply and demand: Consider the following demand and supply functions that provide...
 1. Numerical analysis of supply and demand: Consider the following demand and supply functions that provide information on the market for coffee beans: Qd 50- 2P PT Qs 10+3P where P is the price per pound of coffee beans, Pr is the price per pound of tea, and Qd and Qs are the quantity demanded and the quantity supplied of coffee beans in thousands of pounds. (a) Assuming that Pr 10, graph the market with a clearly labeled graph and...
1. Numerical analysis of supply and demand: Consider the following demand and supply functions that provide...
 1. Numerical analysis of supply and demand: Consider the following demand and supply functions that provide information on the market for coffee beans: Qd 50-2PPr Qs 10+3P where P is the price per pound of coffee beans, Pr is the price per pound of tea, and Qd and Qs are the quantity demanded and the quantity supplied of coffee beans in thousands of pounds. a Assuming that Pr 10, graph the market with a clearly labeled graph and calculate the...
Suppose that the market for green tea can be described by the following demand and supply...
Suppose that the market for green tea can be described by the following demand and supply curves (prices are per kg): Qd = 260 − 5P QS = 8P a) Find the market equilibrium in the absence of taxes. Draw the demand and supply curves, labelling all intercepts and the market equilibrium b) Draw the curves as in the last item, showing clearly the areas representing the consumer surplus (CS) and the producer surplus (PS). Calculate their values and the...
18. Demand and Supply curves can be represented by: Qd = 90-2P; and Qs = 3P....
18. Demand and Supply curves can be represented by: Qd = 90-2P; and Qs = 3P. Using the same Demand and Supply curves that can be represented by: Qd = 90-2P; and Qs = 3P. Consumer Surplus is: $1944 $342 $729 $486
17. Demand and Supply curves can be represented by: Qd = 90-2P; and Qs = 3P....
17. Demand and Supply curves can be represented by: Qd = 90-2P; and Qs = 3P. Using the same Demand and Supply curves that can be represented by: Qd = 90-2P; and Qs = 3P. Producer Surplus is: $486 $243 $118 $900
10 11 1U U JU11CI1115 VIVER 19. Consider the (inverse demand and supply functions, respectively pra by Qa=300-10P (...
 10 11 1U U JU11CI1115 VIVER 19. Consider the (inverse demand and supply functions, respectively pra by Qa=300-10P (or P=30-(1/10)Qd) and Qs=20P (or P=(1/20)Qs). a. Graphically illustrate and label the market, equilibrium, and es welfare (i.e. CS, PS, TS, DWL). b. Numerically calculate the CS, PS, TS, and DWL. noti
Assume that the market demand and supply curves for soybeans grown in Canada can be represented...
Assume that the market demand and supply curves for soybeans grown in Canada can be represented via the following: QD = 40?0.5PS QS = 2.5+2.5PS (1) where PS is the soybean price ($/bushel) and QS is the quantity of soybeans produced (de- nominated in 100 million bushel units). (a) What is the equilibrium price, PS?, and quantity, Q?S, of soybeans? (b) Using Excel or some other spreadsheet program verify your answer to (a) graph- ically.
Suppose the market demand and supply curves are represented by the following equations: Qd = 100...
Suppose the market demand and supply curves are represented by the following equations: Qd = 100 – 0.25P Qs = 40 + 0.25P PART A I already did: a. Determine the equilibrium price and quantity. (Show your calculations) [2 marks] Price can be calculated QD=QS 100- 0.25P = 40+ 0.25P Rewritten as: 60 = 0.5 Price= 120 Quantity can be calculated: QD = 100 – 0.25 (120) = 70 B) illustrate these curves on a graph, labelling these curves, intercepts...
2. Symbolic analysis of supply and demand: The following demand and supply functions provide a relatively...
 2. Symbolic analysis of supply and demand: The following demand and supply functions provide a relatively general description of a market: Qs = D + eP where P is the price, Y is a variable denoting income, and Qd and Qs are the quantity demanded and the quantity supplied. The constants A, b, c, D, and e have values greater than zero. (a) Identify the parameters, endogenous variables, and exogenous variables in the above system of equations. (b) Derive expressions...
 The market demand and supply is described by the following equations QD = 250 - 2P QS 3P 1) Find the market equilibrium. 2) What is the CS, PS, and W in this market? 3) Assume that the government introduces a equilibrium? price ceiling of p = 15. What is the new 4) Find the change in CS, PS, and W. Is there Dead Weight Loss? if so, of how much? 5) What does this tell you about the welfare...
 1. Numerical analysis of supply and demand: Consider the following demand and supply functions that provide information on the market for coffee beans: Qd 50- 2P PT Qs 10+3P where P is the price per pound of coffee beans, Pr is the price per pound of tea, and Qd and Qs are the quantity demanded and the quantity supplied of coffee beans in thousands of pounds. (a) Assuming that Pr 10, graph the market with a clearly labeled graph and...
 1. Numerical analysis of supply and demand: Consider the following demand and supply functions that provide information on the market for coffee beans: Qd 50-2PPr Qs 10+3P where P is the price per pound of coffee beans, Pr is the price per pound of tea, and Qd and Qs are the quantity demanded and the quantity supplied of coffee beans in thousands of pounds. a Assuming that Pr 10, graph the market with a clearly labeled graph and calculate the...
 10 11 1U U JU11CI1115 VIVER 19. Consider the (inverse demand and supply functions, respectively pra by Qa=300-10P (or P=30-(1/10)Qd) and Qs=20P (or P=(1/20)Qs). a. Graphically illustrate and label the market, equilibrium, and es welfare (i.e. CS, PS, TS, DWL). b. Numerically calculate the CS, PS, TS, and DWL. noti
 2. Symbolic analysis of supply and demand: The following demand and supply functions provide a relatively general description of a market: Qs = D + eP where P is the price, Y is a variable denoting income, and Qd and Qs are the quantity demanded and the quantity supplied. The constants A, b, c, D, and e have values greater than zero. (a) Identify the parameters, endogenous variables, and exogenous variables in the above system of equations. (b) Derive expressions...
Most questions answered within 3 hours.
-
The stockholders’ equity section of Concord Corporation’s
balance sheet at December 31 is presented here.
CONCORD...
asked 28 seconds ago -
many biochemical dissolve in the aqueous media of the cell. What
does this imply about the...
asked 8 minutes ago -
In hypothesis testing, it is easier to reject H0 with
a ______________
directional test (one tail)...
asked 6 minutes ago -
Explain how to uphold conditions relating to the work environment,
equipment, materials, procedures and special requirements
asked 6 minutes ago -
The probability of a manufacturing defect in an aluminum
beverage can is .00008 if 100,600 cans...
asked 10 minutes ago -
Which aqueous solution below is most acidic?
a. pH= 3.00
c. [-OH]= 2 x 10^-3
b....
asked 32 minutes ago -
There are four (4) major financial statements: Income Statement,
Retained Earning (Owner's Equity) Statement, Balance Sheet,...
asked 38 minutes ago -
A) Banana, Inc. has a book value per share of $8.70, earnings
per share of $1.68,...
asked 38 minutes ago -
a.)Suppose you were
preparing 1.0 L of a bleaching solution in a volumetric flask, and
it...
asked 48 minutes ago -
write a personal statement of 500 words on the impact you strive
to make using a...
asked 40 minutes ago -
At 25.0 mL sample of 0.100 M HClO (aq) is titrated with NaOH
(aq). What is...
asked 55 minutes ago -
Mark launders his white clothes using the production
function
q=2B +G,
where B is the number...
asked 1 hour ago