
a) What are the lower and upper control limits for this chart if these limits are chosen to be four standard deviations from thetarget?
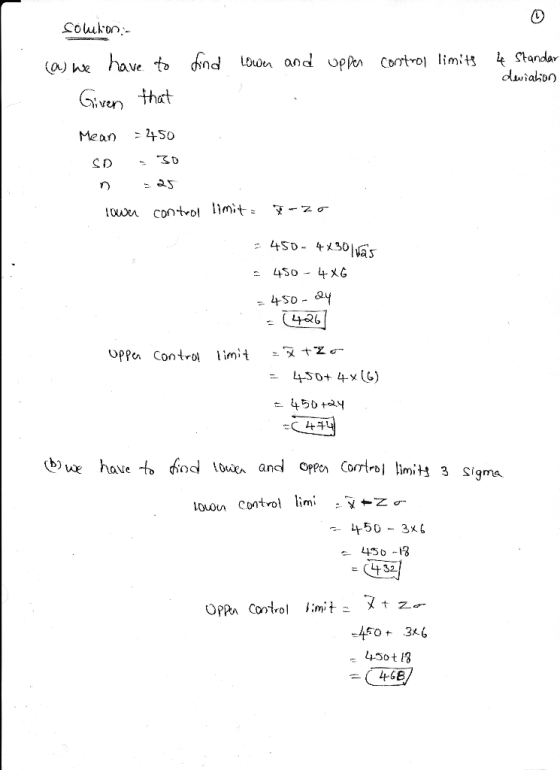
Upper Control Limit (UCL - subscript x) = _______ calories (enter your response as an integer).
Lower Control Limit (LCL- subscript x) = ________calories (enter your response as an integer).
b) What are the limits with three standard deviations from the target?
The 3-sigma x overbarx chart control limitsare:
Upper Control Limit (UCL - subscript x) =___________ calories (enter your response as an integer).
Lower Control Limit (LCL - subscript x) = _______ calories (enter your response as an integer).
Homework Answers
Add Answer to:
a) What are the lower and upper control limits for this chart if
these limits are...
Rosters Chicken advertises lite chicken with 30% fewer calories than standard chicken when the process for...
 Rosters Chicken advertises lite chicken with 30% fewer calories than standard chicken when the process for "The chicken breast production is n control the average chicken breast contains 410 calories, and the standard deviation in caloric content of the chicken breast population is 25 calories Rosters wants to design an x-chart to monitor the caloric content of chicken breasts, where 25 chicken breasts would be chosen at random to form each sample. a) What are the lower and upper control...
Pioneer Chicken advertises "lite" chicken with 30% fewer calories than standard chicken. When the process for...
Pioneer Chicken advertises "lite" chicken with 30% fewer calories than standard chicken. When the process for "lite" chicken breast production is in control, the average chicken breast contains 450 calories, and the standard deviation in caloric content of the chicken breast population is 20 calories.Pioneer wants to design an x-chart to monitor the caloric content of chicken breasts, where 25 chicken breasts would be chosen at random to form each sample. a) What are the lower and upper control limits...
Refer to Table 56.1 - Factors for Computing Control Chart Limits (sigma) for this problem. Thirty-five...
 Refer to Table 56.1 - Factors for Computing Control Chart Limits (sigma) for this problem. Thirty-five samples of size 7 each were taken from a fertilizer-bag-filling machine at Panos Kouvels Lifelong Lawn Lid. The results were: Overal mean = 54.75 lb.: Average range R 164 b. a) For the given sample size, the control limits for 3-sigma x chart are Upper Control Limit (UCL) - D. (round your response to three decimal places). Lower Control Limit (LCL)-1. (round your response...
Refer to Table 56.1 - Factors for Computing Control Chart Limits (3 sigma) for this problem....
 Refer to Table 56.1 - Factors for Computing Control Chart Limits (3 sigma) for this problem. Thirty-five samples of size 7 each were taken from a fertilizer-bag-filling machine at Panos Kouvelis Lifelong Lawn Ltd. The results were: Overall mean = 60.75 lb.: Average range R = 1.78 lb. a) For the given sample size, the controllimits for 3-sigma x chart are: Upper Control Limit (UCL)- b. (round your response to three decimal places). Lower Control Limit (LCL:) - (round your...
Product filling weights are normally distributed with a mean of 365 grams and a standard deviation of 19 grams. a. Compute the chart upper control limit and lower control limit for this process if sa...
 Product filling weights are normally distributed with a mean of 365 grams and a standard deviation of 19 grams. a. Compute the chart upper control limit and lower control limit for this process if samples of size 10, 20 and 30 are used (to 2 decimals). Use Table 19.3. For samples of size 10 UCL =| LCL For a sample size of 20 UCL = LCL For a sample size of 30 UCL = LCL = b. What happens to...
a production process is considered in control if up to 4% of items produced are defective. samples of size 100 are used for the inspection process. determine the upper and lower control limits for the...
a production process is considered in control if up to 4% of items produced are defective. samples of size 100 are used for the inspection process. determine the upper and lower control limits for the p chart. A. UCL= .0988 LCL=0.0000 B. UCL=.0888 LCL= 0.000 C. UCL= .0788 LCL= .01 D. UCL= 0.0688 LCL= .02
that was the complete data the second picture is the control limits Refer to Table S61...
 that was the complete data the second picture is the control
limits
Refer to Table S61 - Factors for Computing Control Chart Limits (3 sigma) for this problem. Ross Hopkins is attempting to monitor a filling process that has an overall average of 705 mL. The average range R is 8 ml. For a sample size of 10, the control limits for 3-sigma x chart are: Upper Control Limit (UCL.2)= ml (round your response to three decimal places). Lower Control...
that was the complete data the second picture is the control
limits
Refer to Table S61 - Factors for Computing Control Chart Limits (3 sigma) for this problem. Ross Hopkins is attempting to monitor a filling process that has an overall average of 705 mL. The average range R is 8 ml. For a sample size of 10, the control limits for 3-sigma x chart are: Upper Control Limit (UCL.2)= ml (round your response to three decimal places). Lower Control...
Upper Control Limit= Lower Control Limit = If three standard deviations are used in the chart,...
 Upper Control Limit=
Lower Control Limit =
If three standard deviations are used in the chart, what are
the values of the control limits:
Upper Control Limit =
Lower Control Limit=
A Choudhury's bowling ball factory in illinois makes bowling balls of adult size and weight only. The standard deviation in the weight of a bowling ball produced at the factory is kno average weight, in pounds, of 9 of the bowling balls produced that day has been assessed as...
Upper Control Limit=
Lower Control Limit =
If three standard deviations are used in the chart, what are
the values of the control limits:
Upper Control Limit =
Lower Control Limit=
A Choudhury's bowling ball factory in illinois makes bowling balls of adult size and weight only. The standard deviation in the weight of a bowling ball produced at the factory is kno average weight, in pounds, of 9 of the bowling balls produced that day has been assessed as...
Question 15 1 pts Using the following sample set, determine the upper and lower control limits...
 Question 15 1 pts Using the following sample set, determine the upper and lower control limits for an X-Chart: 15, 10, 12,9.11.11. 15. 9, 10, 14 UCL LCL Choose Choose 11.75 13.45 10.25 15.56 9.75 14.46 [ Choose Next
Consider a normally distributed population with mean µ = 75 and standard deviation σ = 11....
Consider a normally distributed population with mean µ = 75 and standard deviation σ = 11. a. Calculate the centerline, the upper control limit (UCL), and the lower control limit (LCL) for the x¯x¯ chart if samples of size 6 are used. (Round the value for the centerline to the nearest whole number and the values for the UCL and LCL to 2 decimal places.) centerline upper control limit lower control limit b. Calculate the centerline, the upper control...
 Rosters Chicken advertises lite chicken with 30% fewer calories than standard chicken when the process for "The chicken breast production is n control the average chicken breast contains 410 calories, and the standard deviation in caloric content of the chicken breast population is 25 calories Rosters wants to design an x-chart to monitor the caloric content of chicken breasts, where 25 chicken breasts would be chosen at random to form each sample. a) What are the lower and upper control...
 Refer to Table 56.1 - Factors for Computing Control Chart Limits (sigma) for this problem. Thirty-five samples of size 7 each were taken from a fertilizer-bag-filling machine at Panos Kouvels Lifelong Lawn Lid. The results were: Overal mean = 54.75 lb.: Average range R 164 b. a) For the given sample size, the control limits for 3-sigma x chart are Upper Control Limit (UCL) - D. (round your response to three decimal places). Lower Control Limit (LCL)-1. (round your response...
 Refer to Table 56.1 - Factors for Computing Control Chart Limits (3 sigma) for this problem. Thirty-five samples of size 7 each were taken from a fertilizer-bag-filling machine at Panos Kouvelis Lifelong Lawn Ltd. The results were: Overall mean = 60.75 lb.: Average range R = 1.78 lb. a) For the given sample size, the controllimits for 3-sigma x chart are: Upper Control Limit (UCL)- b. (round your response to three decimal places). Lower Control Limit (LCL:) - (round your...
 Product filling weights are normally distributed with a mean of 365 grams and a standard deviation of 19 grams. a. Compute the chart upper control limit and lower control limit for this process if samples of size 10, 20 and 30 are used (to 2 decimals). Use Table 19.3. For samples of size 10 UCL =| LCL For a sample size of 20 UCL = LCL For a sample size of 30 UCL = LCL = b. What happens to...
 that was the complete data the second picture is the control
limits
Refer to Table S61 - Factors for Computing Control Chart Limits (3 sigma) for this problem. Ross Hopkins is attempting to monitor a filling process that has an overall average of 705 mL. The average range R is 8 ml. For a sample size of 10, the control limits for 3-sigma x chart are: Upper Control Limit (UCL.2)= ml (round your response to three decimal places). Lower Control...
that was the complete data the second picture is the control
limits
Refer to Table S61 - Factors for Computing Control Chart Limits (3 sigma) for this problem. Ross Hopkins is attempting to monitor a filling process that has an overall average of 705 mL. The average range R is 8 ml. For a sample size of 10, the control limits for 3-sigma x chart are: Upper Control Limit (UCL.2)= ml (round your response to three decimal places). Lower Control...
 Upper Control Limit=
Lower Control Limit =
If three standard deviations are used in the chart, what are
the values of the control limits:
Upper Control Limit =
Lower Control Limit=
A Choudhury's bowling ball factory in illinois makes bowling balls of adult size and weight only. The standard deviation in the weight of a bowling ball produced at the factory is kno average weight, in pounds, of 9 of the bowling balls produced that day has been assessed as...
Upper Control Limit=
Lower Control Limit =
If three standard deviations are used in the chart, what are
the values of the control limits:
Upper Control Limit =
Lower Control Limit=
A Choudhury's bowling ball factory in illinois makes bowling balls of adult size and weight only. The standard deviation in the weight of a bowling ball produced at the factory is kno average weight, in pounds, of 9 of the bowling balls produced that day has been assessed as...
 Question 15 1 pts Using the following sample set, determine the upper and lower control limits for an X-Chart: 15, 10, 12,9.11.11. 15. 9, 10, 14 UCL LCL Choose Choose 11.75 13.45 10.25 15.56 9.75 14.46 [ Choose Next
Most questions answered within 3 hours.
-
Write a program to solve the Josephus problem, with the following
modification:
Sample Input:
./a.out n...
asked 56 minutes ago -
At the start of a CD it is spinning at a rate of 525 rpm
(revolutions...
asked 1 hour ago -
4. Without doing any calculations, predict whether the observed
∆T would increase, decrease or remain the...
asked 2 hours ago -
Based on the range, which of the following sets of scores has
the greatest variability? 3,...
asked 3 hours ago -
Ripples in a pond travel at a velocity of 3 m/s with one peak
passing a...
asked 3 hours ago -
A man stands on the roof of a building of height 13.0 mm and
throws a...
asked 3 hours ago -
The extent to which assets are financed by borrowed funds and
other liabilities is indicated by:...
asked 4 hours ago -
Explain in detail
Germany is the fifth largest economy
explain what goods and services Germany specializes...
asked 5 hours ago -
The density of platinum is 21.45 g/mL. If a cube of platinum
with a mass of...
asked 5 hours ago -
Accounts Receivable
Sales
A/R Posting
Extended Sales Invoice
Packing Slip
Compare invoice to packing slip 2...
asked 5 hours ago -
Michaella, age 23, is a full-time law student and is claimed by
her parents as a...
asked 5 hours ago -
Why are polymers not typically casted into products?
asked 5 hours ago