

Homework Answers
Solution:
a) stock return is right answer
b) Option C is right answer
 The coefficient of correlation
is r=-0.0289
The coefficient of correlation
is r=-0.0289
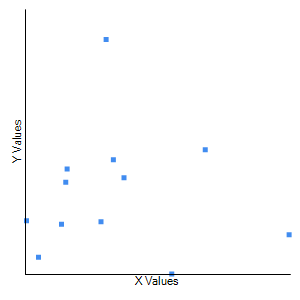
d) the linear correlation coefficient is close to 0, so there is no linear relation exist between compensation and stock return. It appears that stock performance play no role in determine the compensation of CEO
Add Answer to:
-) to determine the exp Company mi Return (%) 25 Compensation o Company A Company B...
The accompanying data represent the total compensation for 12 randomly selected chief executive officers (CEO) and...
 The accompanying data represent the total compensation for 12 randomly selected chief executive officers (CEO) and the company's stock performance in a recent year. Complete parts (a) through (d) below. Click the icon to view the CEO data. (a) One would think that a higher stock return would lead to a higher compensation. Based on this, what would likely be the explanatory variable? O O Stock return Compensation (b) Draw a scatter diagram of the data. Use the result from...
ASSINE Meula Question Help The accompanying data represent the total compensation for 12 randomly selected chief...
 ASSINE Meula Question Help The accompanying data represent the total compensation for 12 randomly selected chief executive officers (CEO) and the company's stock performance in a recent year. Complete parts (a) through (d) below. B: Click the icon to view the CEO data (a) One would think that a higher stock return would lead to a higher compensation. Based on this, what would likely be the explanatory variable? Stock return O Compensation (b) Draw a scatter diagram of the data....
The accompanying data represent the total compensation for 12 randomly selected chief executive officers (CEO) and...
 The accompanying data represent the total compensation for 12 randomly selected chief executive officers (CEO) and the company's stock performance in a recent year. Complete parts (a) through (d) below. Click the icon to view the CEO data. (a) One would think that a higher stock return would lead to a higher compensation. Based on this, what would likely be the explanatory variable? Stock return Compensation (b) Draw a scatter diagram of the data. Use the result from part (a)...
accompanying data represent the total compensation for 12 randomly selected chief executive officers (CEOs) and the...
accompanying data represent the total compensation for 12 randomly selected chief executive officers (CEOs) and the company's stock performance. Use the data to complete parts (a) through (d). beta 0β0 and beta 1β1. The estimate of beta 1β1 is? (Round to three decimal places as needed.) Data Table of Compensation and Stock Performance Company Compensation (millions of dollars) Stock Return (%) A 15.98 77.34 B 4.17 67.65 C 6.18 140.24 D 1.16 32.11 E 1.85 10.43 F 2.24 29.52 G...
The data in the accompanying table represent the rate of return of a certain company stock...
 The
data in the accompanying table represent the rate of return of a
certain company stock for 11 months, compared with the rate of
return of a certain index of 500 stocks.
Assuming the residuals are normally distributed, test whether
linear relation exist between the rate of return of the index, x,
And the rate of return for the company stock, y, at the a=0.10
level of significance.
in Month Apr-18 May-18 Jun-18 Jul-18 Aug-18 Sept-18 Oct-18 Nov-18 Dec-18 Jan-19...
The
data in the accompanying table represent the rate of return of a
certain company stock for 11 months, compared with the rate of
return of a certain index of 500 stocks.
Assuming the residuals are normally distributed, test whether
linear relation exist between the rate of return of the index, x,
And the rate of return for the company stock, y, at the a=0.10
level of significance.
in Month Apr-18 May-18 Jun-18 Jul-18 Aug-18 Sept-18 Oct-18 Nov-18 Dec-18 Jan-19...
I need help with - (d) Based on your results to parts (b) and (c), would...
I need help with - (d) Based on your results to parts (b) and (c), would you recommend using the least-squares regression line to predict the stock return of a company based on the CEO's compensation? Why? What would be a good estimate of the stock return based on the data in the table? - the final part of the problem. Thank you! The accompanying data represent the total compensation for 12 randomly selected chief executive officers (CEOs) and the...
CASE 20 Enron: Not Accounting for the Future* INTRODUCTION Once upon a time, there was a...
 CASE 20 Enron: Not Accounting for the Future* INTRODUCTION Once upon a time, there was a gleaming office tower in Houston, Texas. In front of that gleaming tower was a giant "E" slowly revolving, flashing in the hot Texas sun. But in 2001, the Enron Corporation, which once ranked among the top Fortune 500 companies, would collapse under a mountain of debt that had been concealed through a complex scheme of off-balance-sheet partnerships. Forced to declare bankruptcy, the energy firm...
 The accompanying data represent the total compensation for 12 randomly selected chief executive officers (CEO) and the company's stock performance in a recent year. Complete parts (a) through (d) below. Click the icon to view the CEO data. (a) One would think that a higher stock return would lead to a higher compensation. Based on this, what would likely be the explanatory variable? O O Stock return Compensation (b) Draw a scatter diagram of the data. Use the result from...
 ASSINE Meula Question Help The accompanying data represent the total compensation for 12 randomly selected chief executive officers (CEO) and the company's stock performance in a recent year. Complete parts (a) through (d) below. B: Click the icon to view the CEO data (a) One would think that a higher stock return would lead to a higher compensation. Based on this, what would likely be the explanatory variable? Stock return O Compensation (b) Draw a scatter diagram of the data....
 The accompanying data represent the total compensation for 12 randomly selected chief executive officers (CEO) and the company's stock performance in a recent year. Complete parts (a) through (d) below. Click the icon to view the CEO data. (a) One would think that a higher stock return would lead to a higher compensation. Based on this, what would likely be the explanatory variable? Stock return Compensation (b) Draw a scatter diagram of the data. Use the result from part (a)...
 The
data in the accompanying table represent the rate of return of a
certain company stock for 11 months, compared with the rate of
return of a certain index of 500 stocks.
Assuming the residuals are normally distributed, test whether
linear relation exist between the rate of return of the index, x,
And the rate of return for the company stock, y, at the a=0.10
level of significance.
in Month Apr-18 May-18 Jun-18 Jul-18 Aug-18 Sept-18 Oct-18 Nov-18 Dec-18 Jan-19...
The
data in the accompanying table represent the rate of return of a
certain company stock for 11 months, compared with the rate of
return of a certain index of 500 stocks.
Assuming the residuals are normally distributed, test whether
linear relation exist between the rate of return of the index, x,
And the rate of return for the company stock, y, at the a=0.10
level of significance.
in Month Apr-18 May-18 Jun-18 Jul-18 Aug-18 Sept-18 Oct-18 Nov-18 Dec-18 Jan-19...
 CASE 20 Enron: Not Accounting for the Future* INTRODUCTION Once upon a time, there was a gleaming office tower in Houston, Texas. In front of that gleaming tower was a giant "E" slowly revolving, flashing in the hot Texas sun. But in 2001, the Enron Corporation, which once ranked among the top Fortune 500 companies, would collapse under a mountain of debt that had been concealed through a complex scheme of off-balance-sheet partnerships. Forced to declare bankruptcy, the energy firm...
Most questions answered within 3 hours.
-
Grandma Assignment: This was my previous professor’s son’s
fourth grade homework assign- ment. Maxine, Mabel, Mavis,...
asked 11 seconds ago -
Write the pseudocode below as a working Python program.
Take a screenshot of your code and...
asked 15 minutes ago -
Calculate the concentrations of all species in a 0.810 M
Na2SO30.810 M Na2SO3 (sodium sulfite) solution....
asked 22 minutes ago -
Deciding Whether to Use Flexible Staffing
The Kaiser Manufacturing Com pany (KMC) has been in existence...
asked 12 minutes ago -
True or False for the following statement:
All of the B cells in your body right...
asked 19 minutes ago -
How many grams of H2SO4 must be dissolved into 0.709 L of
solution to generate a...
asked 32 minutes ago -
You are designing a new airplane (the Whizbang 450) under the
new Part 23 of the...
asked 40 minutes ago -
An aqueous solution is 23% glucose by mass (d = 1.090 g/mL at
20.°C). Calculate its...
asked 41 minutes ago -
The commercial
division of a real estate firm is conducting a regression analysis
of the relationship...
asked 42 minutes ago -
a jar contains 5 red, 10 blue, and 7 green marbles. three
marbles are selected, color...
asked 42 minutes ago -
In Drosophila, the fused mutation (fu) causes fused wing veins,
the tan mutation (t) causes a...
asked 57 minutes ago -
How does the 2015 mandated 25% cut on water supply to local
agencies, imposed by the...
asked 57 minutes ago