MATlab
I'm trying to create the b matrix with the x and y points. The h's are delta x's. I keep getting the error matrix dimension must agree how do i fix this? I would like to not use a loop.
x = [0.9 1.3 1.9 2.1 2.6 3.0 3.9 4.4 4.7];
a = [1.3 1.5 1.85 2.1 2.6 2.7 2.4 2.15 2.05];
h = x(2:end) - x(1:end-1);
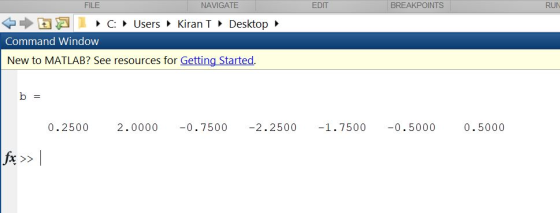
b =
(3./h(2:end).*a(3:end)-a(2:end-1))-(3./h(1:end).*a(2:end)-a(1:end-1))


Homework Answers
Your program is ok, but made one small mistake in last commands, as 'a' is running from
 .
also please take care of the braces in last command, otherwise
answer will be wrong even for same matrix dimensions.
.
also please take care of the braces in last command, otherwise
answer will be wrong even for same matrix dimensions.
I have given the correction in bold letters, please check the below commands,
code:
clc; clear all
x = [0.9 1.3 1.9 2.1 2.6 3.0 3.9 4.4 4.7];
a = [1.3 1.5 1.85 2.1 2.6 2.7 2.4 2.15 2.05];
h = x(2:end) - x(1:end-1);
b =
((3./h(2:end)).*(a(3:end)-a(2:end-1)))-((3./h(1:end-1)).*(a(2:end-1)-a(1:end-2)))
Output:
Add Answer to:
MATlab
I'm trying to create the b matrix with the x and y points. The
h's...
Recent research indicates that the effectiveness of antidepressant medication is directly related to the severity of...
Recent research indicates that the effectiveness of antidepressant medication is directly related to the severity of the depression (Khan, Brodhead, Kolts & Brown, 2005). Based on pretreatment depression scores, patients were divided into four groups based on their level of depression. After receiving the antidepressant medication, depression scores were measured again and the amount of improvement was recorded for each patient. The following data are similar to the results of the study. Low Moderate High Moderate Moderately Severe Severe 1.2...
A sociologist claims that children spent more time watching television in 1981 than children do t...
A sociologist claims that children spent more time watching television in 1981 than children do today. A study was conducted in 1981 to find the time that children watched television on weekdays. Recently, a similar study was conducted. The results of these studies (in hours per weekday) are shown below. Assume the population standard deviation is 0.7 for 1981 and 0.7 for today. At α=0.05, can you support the sociologist's claim? Complete parts (a) through (d) below. 1981 3.2 1.4...
Parametirc test or not: Test statistic: p-value: decision: Is There A Difference Between the Means?
Parametirc test or not:Test statistic:p-value:decision:Is There A Difference Between the Means?6.7 6.2 3.1 310.3 10 5 5.56.9 5.5 3.3 3.110.5 6.3 4.3 5.44.5 4.6 1.8 25.6 5.6 2 2.65.9 6.1 2.1 2.58 11.7 4 4.68 7.4 3.3 3.15.8 5.2 3.1 2.96 7.3 3.0 3.28.7 5.3 2.7 36 5.5 2.1 2.27.2 6.3 3.5 3.25.9 4.6 2.9 3.46 7.4 3 3.37.2 7.8 3.7 3.48.6 9.4 5.1 5.77.2 8.1 2.8 3.15.8 5.4 2.2 1.83.3 4 1.7 1.86.8 5.1 2 1.83.7 3.5 2.2 2.112...
GRF: Ground Reaction Forces Jump Impulse: Takeoff Velocity: Jump-height: An athlete did a vertical jump. The...
 GRF: Ground Reaction Forces
Jump Impulse:
Takeoff Velocity:
Jump-height:
An athlete did a vertical jump. The measured GRF is shown in the figure below. How high can she jump? 1300 1250 1200 1150 1100 1050 1000 950 900 850 GRF [N] 0 + 0.5 0.55 0.6 0.65 0.7 0.75 0.8 0.85 0.9 0.95 1 1.05 1.1 1.15 1.2 1.25 1.3 1.35 1.4 1.45 1.5 1.55 1.6 1.65 1.7 1.75 1.8 1.85 1.9 1.95 2 2.05 2.1 2.15 2.2 time [s]
GRF: Ground Reaction Forces
Jump Impulse:
Takeoff Velocity:
Jump-height:
An athlete did a vertical jump. The measured GRF is shown in the figure below. How high can she jump? 1300 1250 1200 1150 1100 1050 1000 950 900 850 GRF [N] 0 + 0.5 0.55 0.6 0.65 0.7 0.75 0.8 0.85 0.9 0.95 1 1.05 1.1 1.15 1.2 1.25 1.3 1.35 1.4 1.45 1.5 1.55 1.6 1.65 1.7 1.75 1.8 1.85 1.9 1.95 2 2.05 2.1 2.15 2.2 time [s]
please fill in the chart the first line is an example O4 7 H-8 nuHipl Seriet 3.8 3.7 3.6 3.5 3.4 X: parts per Mill...
 please fill in the chart
the first line is an example
O4 7 H-8 nuHipl Seriet 3.8 3.7 3.6 3.5 3.4 X: parts per Mill lon: 1H 3.3 3.2 3.1 3.0 2.9 2.8 2.7 2.6 2.5 2.4 23 2.2 2.1 20 1.9 18 1.7 16 L.5 1.4 1.3 12 L1 L0 09 a3uepunqe chemical shift, (ppm) possible functionality or chain fragment neighboring 'H multiplicity integration isopropyl group close to an 3.55 septet 1 oxygen or halogen
please fill in the chart
the first line is an example
O4 7 H-8 nuHipl Seriet 3.8 3.7 3.6 3.5 3.4 X: parts per Mill lon: 1H 3.3 3.2 3.1 3.0 2.9 2.8 2.7 2.6 2.5 2.4 23 2.2 2.1 20 1.9 18 1.7 16 L.5 1.4 1.3 12 L1 L0 09 a3uepunqe chemical shift, (ppm) possible functionality or chain fragment neighboring 'H multiplicity integration isopropyl group close to an 3.55 septet 1 oxygen or halogen
A sociologist claims that children spent more time watching television in 1981 than children do today....
 A sociologist claims that children spent more time watching television in 1981 than children do today. A study was conducted in 1981 to find the time that children watched television on weekdays. Recently, a similar study was conducted. The results of these studies (in hours per weekday are shown below. Assume the population standard deviation is 0.7 for 1981 and 0.8 for today, At a = 0.05, can you support the sociologist's claim? Complete parts (a) through (d) below. Full...
I am trying to create a function to read 2 csv files that contain 5 columns...
I am trying to create a function to read 2 csv files that contain 5 columns of data. Columns 1-4 are floats and column 5 is a string. I want to only work on with the floats to perform some calculations such as sum of the first 2 columns of each file and then return the closest numbers then return the string to identify the 2 rows of data. Below is what I have so far. There is a stipulation...
Can you please show the structure of the ester and fill out an NMR analysis table...
 Can you please show the structure of the ester and fill out an
NMR analysis table for the synthesis of banana based on the NMR
below? Could you also briefly explain your choice?
2. Banana
Acid: Acetic acid
Alcohol: Isoamyl alcohol
Structure of the ester:
Example of a’H-NMR analysis table: Hb Ho Labeled structure: Ha Há Ha Chemical Shift (ppm) Integration Splitting (n+1 rule) Structural Assignment (label of the corresponding proton) 1.8 ppm 3 3 Н. 3.1 ppm 2 4...
Can you please show the structure of the ester and fill out an
NMR analysis table for the synthesis of banana based on the NMR
below? Could you also briefly explain your choice?
2. Banana
Acid: Acetic acid
Alcohol: Isoamyl alcohol
Structure of the ester:
Example of a’H-NMR analysis table: Hb Ho Labeled structure: Ha Há Ha Chemical Shift (ppm) Integration Splitting (n+1 rule) Structural Assignment (label of the corresponding proton) 1.8 ppm 3 3 Н. 3.1 ppm 2 4...
The table below gives the birth weights in pounds of piglets in 8 randomly selected litters...
The table below gives the birth weights in pounds of piglets in 8 randomly selected litters from large number of litters in a state. Litter 1 2 3 4 5 6 7 8 2.0 3.5 3.3 3.2 2.6 3.1 2.6 2.5 2.8 2.8 1.6 3.3 2.6 2.9 2.2 2.4 3.3 3.2 3.6 3.2 2.9 3.1 2.2 3.0 3.2 3.5 3.1 1.9 2.0 2.5 2.5 1.5 4.4 2.3 3.2 3.3 2.0 1.2 3.6 2.4 3.3 2.5 2.1 1.2 1.9 2.0 2.9 ...
Autocorrelation of an X(t) random process is Rxx (t1, t2) = 4e-t-t2 This a Gaussian process...
 Autocorrelation of an X(t) random process is Rxx (t1, t2) = 4e-t-t2 This a Gaussian process with mean zero. a) [6p] Is this process wide sense stationary? Briefly explain. b) [9p] Calculate the probability P (X(2)> 1) using the Table at the cover. c) [10p] Calculate approximately the probability P(X(2) > X(4) + 1). Some useful relations 1. Var(X(t)) = E({€)) - (E(X(t))) 2. R(X(t)X(t) = ELX(t-)X(02)]| 3. Var(X(c) +X)) = Var( (t) ) + Var (X (t2) - 2Cov(X...
 GRF: Ground Reaction Forces
Jump Impulse:
Takeoff Velocity:
Jump-height:
An athlete did a vertical jump. The measured GRF is shown in the figure below. How high can she jump? 1300 1250 1200 1150 1100 1050 1000 950 900 850 GRF [N] 0 + 0.5 0.55 0.6 0.65 0.7 0.75 0.8 0.85 0.9 0.95 1 1.05 1.1 1.15 1.2 1.25 1.3 1.35 1.4 1.45 1.5 1.55 1.6 1.65 1.7 1.75 1.8 1.85 1.9 1.95 2 2.05 2.1 2.15 2.2 time [s]
GRF: Ground Reaction Forces
Jump Impulse:
Takeoff Velocity:
Jump-height:
An athlete did a vertical jump. The measured GRF is shown in the figure below. How high can she jump? 1300 1250 1200 1150 1100 1050 1000 950 900 850 GRF [N] 0 + 0.5 0.55 0.6 0.65 0.7 0.75 0.8 0.85 0.9 0.95 1 1.05 1.1 1.15 1.2 1.25 1.3 1.35 1.4 1.45 1.5 1.55 1.6 1.65 1.7 1.75 1.8 1.85 1.9 1.95 2 2.05 2.1 2.15 2.2 time [s]
 please fill in the chart
the first line is an example
O4 7 H-8 nuHipl Seriet 3.8 3.7 3.6 3.5 3.4 X: parts per Mill lon: 1H 3.3 3.2 3.1 3.0 2.9 2.8 2.7 2.6 2.5 2.4 23 2.2 2.1 20 1.9 18 1.7 16 L.5 1.4 1.3 12 L1 L0 09 a3uepunqe chemical shift, (ppm) possible functionality or chain fragment neighboring 'H multiplicity integration isopropyl group close to an 3.55 septet 1 oxygen or halogen
please fill in the chart
the first line is an example
O4 7 H-8 nuHipl Seriet 3.8 3.7 3.6 3.5 3.4 X: parts per Mill lon: 1H 3.3 3.2 3.1 3.0 2.9 2.8 2.7 2.6 2.5 2.4 23 2.2 2.1 20 1.9 18 1.7 16 L.5 1.4 1.3 12 L1 L0 09 a3uepunqe chemical shift, (ppm) possible functionality or chain fragment neighboring 'H multiplicity integration isopropyl group close to an 3.55 septet 1 oxygen or halogen
 A sociologist claims that children spent more time watching television in 1981 than children do today. A study was conducted in 1981 to find the time that children watched television on weekdays. Recently, a similar study was conducted. The results of these studies (in hours per weekday are shown below. Assume the population standard deviation is 0.7 for 1981 and 0.8 for today, At a = 0.05, can you support the sociologist's claim? Complete parts (a) through (d) below. Full...
 Can you please show the structure of the ester and fill out an
NMR analysis table for the synthesis of banana based on the NMR
below? Could you also briefly explain your choice?
2. Banana
Acid: Acetic acid
Alcohol: Isoamyl alcohol
Structure of the ester:
Example of a’H-NMR analysis table: Hb Ho Labeled structure: Ha Há Ha Chemical Shift (ppm) Integration Splitting (n+1 rule) Structural Assignment (label of the corresponding proton) 1.8 ppm 3 3 Н. 3.1 ppm 2 4...
Can you please show the structure of the ester and fill out an
NMR analysis table for the synthesis of banana based on the NMR
below? Could you also briefly explain your choice?
2. Banana
Acid: Acetic acid
Alcohol: Isoamyl alcohol
Structure of the ester:
Example of a’H-NMR analysis table: Hb Ho Labeled structure: Ha Há Ha Chemical Shift (ppm) Integration Splitting (n+1 rule) Structural Assignment (label of the corresponding proton) 1.8 ppm 3 3 Н. 3.1 ppm 2 4...
 Autocorrelation of an X(t) random process is Rxx (t1, t2) = 4e-t-t2 This a Gaussian process with mean zero. a) [6p] Is this process wide sense stationary? Briefly explain. b) [9p] Calculate the probability P (X(2)> 1) using the Table at the cover. c) [10p] Calculate approximately the probability P(X(2) > X(4) + 1). Some useful relations 1. Var(X(t)) = E({€)) - (E(X(t))) 2. R(X(t)X(t) = ELX(t-)X(02)]| 3. Var(X(c) +X)) = Var( (t) ) + Var (X (t2) - 2Cov(X...
Most questions answered within 3 hours.
-
lease solve all the
questions, don't need to explanations
Q1 - All animal
species have general...
asked 3 minutes ago -
Business Phasing
1.Discuss the logical progression for growing a business, which
starts from the initial idea...
asked 9 minutes ago -
Modify
When executing on the command line having only
this program name, the program will accept...
asked 1 hour ago -
Kenny Electric Company's noncallable bonds were issued several
years ago and now have 20 years to...
asked 1 hour ago -
find H(e^Jtheta) at theta= 0, pi/10, pi/20, pi/2 for
the following:
a) H(e^Jtheta)= 1+e^Jtheta
b) H(e^Jtheta)=...
asked 2 hours ago -
Home Corporation will open a new store on January 1. Based on
experience from its other...
asked 2 hours ago -
In a neoclassical model, use the IS-LM to analyze the effect of
a permanent money supply...
asked 2 hours ago -
An electron passes through a point 2.67 cm from a long straight
wire as it moves...
asked 3 hours ago -
A grammar is a 4-tuple G, G = (Ν, Σ, Π, Σ, S) where, Ν is...
asked 4 hours ago -
In this part, calculate the present values. Use the Excel PV
function to compute the present...
asked 4 hours ago -
Part 1. Primitive Types, Sorting, Recursion for
Homework.java
a) Implement the static method initializeArray that receives...
asked 5 hours ago -
Using C++, build a sorter that can rank a sequence of numbers in
a descending order....
asked 5 hours ago