I am trying to create a function to read 2 csv files that contain 5 columns...
I am trying to create a function to read 2 csv files that contain 5 columns of data. Columns 1-4 are floats and column 5 is a string.
I want to only work on with the floats to perform some calculations such as sum of the first 2 columns of each file and then return the closest numbers then return the string to identify the 2 rows of data.
Below is what I have so far. There is a stipulation that I can only use the numpy import.
data =[(x.rstrip()) for x in open('test.csv')]
data2 =[(x.rstrip()) for x in open('training.csv')]
k= len(data)
datas = dict(zip(range(k),data[0:k]))
datas2 = dict(zip(range(k),datas[0:k]))
Data used:
| Training | ||||
| a1 | b1 | c1 | d1 | name training |
| 5 | 3 | 1.6 | 0.2 | G |
| 5 | 3.4 | 1.6 | 0.4 | G |
| 5.5 | 2.4 | 3.7 | 1 | R |
| 5.8 | 2.7 | 3.9 | 1.2 | R |
| 7.2 | 3.2 | 6 | 1.8 | Y |
| 6.2 | 2.8 | 4.8 | 1.8 | Y |
| testing | ||||
| a2 | b2 | c2 | d2 | name true |
| 5 | 3.6 | 1.4 | 0.2 | G |
| 5.4 | 3.9 | 1.7 | 0.4 | G |
| 6.9 | 3.1 | 4.9 | 1.5 | R |
| 5.5 | 2.3 | 4 | 1.3 | R |
| 6.4 | 2.7 | 5.3 | 1.9 | Y |
| 6.8 | 3 | 5.5 | 2.1 | Y |
Homework Answers
# The Code first sums the first two columns of train and test files and then find difference between the sums. The difference which <=1 is nearest in both train and test. So it prints out the corresponding 'name training'.
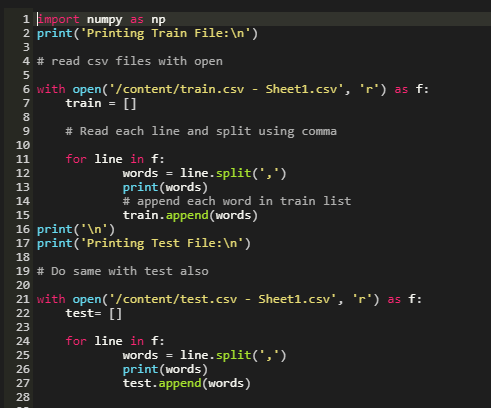


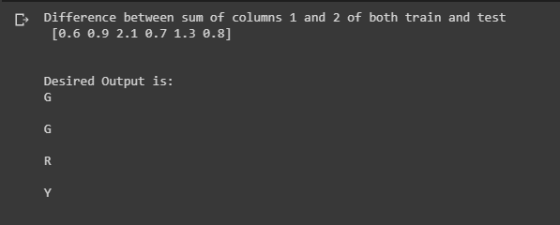
Please comment for any query.
Add Answer to:
I am trying to create a function to read 2 csv files that
contain 5 columns...
I need help modifying this python code: a) I need to take 2 attributes of the...
I need help modifying this python code: a) I need to take 2 attributes of the data as int - (columns (3 & 5) of my data) b) I need to take 2 more attributes as floats -(columns 4&6 of my data) c) I need to take 1 attribute as string (column 16 of my data) How would I modify this code # # Initial version - "standard programming" # # Define a list for the data. The data structure...
Homework #1-Chapter1&2&4&5 (20pts for turned in on time) 7. (14pts)Carbon Dioxide Emissions. Burning fuels in power...
 Homework #1-Chapter1&2&4&5 (20pts for turned in on time) 7. (14pts)Carbon Dioxide Emissions. Burning fuels in power plants or motor vehicles emits carbon dioxide (CO2), which contributes to global warming. Table below shows CO2 emissions per person from countries with populations of at least 20 million. Carbon Dioxide emissions (metric tons per person) CO2 Country Ukraine SouthAfrica Italy Poland CO2 Country Country CO2 6.3 1.6 Ethiopia 0.1 Indonesia 7 1.8 Nepal Tanzania 0.1 Brazil 7.8 2 0.1 Egypt 7.8 Congo 2.6...
How would I make the Excel speadsheet do these things in seperate colums? A B 2...
 How would I make the Excel speadsheet do
these things in seperate colums?
A B 2 1 ld 21 3 M IN L Doors Lowercase Sentence 3 3 4. 3 بیب 32 بیب 7 8 بیب بیب 9 10 بیب بیب 12 بیب 13 بیب C D E F Price Age_08_04 Mfg_Year KM 13500 23 200246986 13750 23 2002 72937 13950 24 2002 41711 14950 26 2002 48000 13750 30 2002 38500 12950 2002 61000 16900 27 2002 94612 18600...
How would I make the Excel speadsheet do
these things in seperate colums?
A B 2 1 ld 21 3 M IN L Doors Lowercase Sentence 3 3 4. 3 بیب 32 بیب 7 8 بیب بیب 9 10 بیب بیب 12 بیب 13 بیب C D E F Price Age_08_04 Mfg_Year KM 13500 23 200246986 13750 23 2002 72937 13950 24 2002 41711 14950 26 2002 48000 13750 30 2002 38500 12950 2002 61000 16900 27 2002 94612 18600...
I need to match these ten industries using Exhibit 3: For example, Electrical Utility is #8 and Retail Grocery is #7. Pl...
 I need to match these ten industries using Exhibit 3: For
example, Electrical Utility is #8 and Retail Grocery is #7. Please
help! Thanks. I have 7 confirmed these are:
Each of the 10 publicly traded companies in Exhibit 3 is drawn
from one of the following industries (listed below in random
order):
I have 7 confirmed these are:
1. Management consulting services
2.
3. Data processing and camera
applications services
4. Electronic, aerospace, communication, sensor
systems
5. Hospital and...
I need to match these ten industries using Exhibit 3: For
example, Electrical Utility is #8 and Retail Grocery is #7. Please
help! Thanks. I have 7 confirmed these are:
Each of the 10 publicly traded companies in Exhibit 3 is drawn
from one of the following industries (listed below in random
order):
I have 7 confirmed these are:
1. Management consulting services
2.
3. Data processing and camera
applications services
4. Electronic, aerospace, communication, sensor
systems
5. Hospital and...
According to Case 06 Exhibit 6.1, what is Company P Operating Margin? Enter percentage, round to...
 According to Case 06 Exhibit 6.1, what is Company P Operating
Margin? Enter percentage, round to 2 decimal places.
Retail Airlines A B Beer C D Computers E F Hospitality G H Newspaper I J Pharmaceuticals K L Power M N Assets % O P 72 25 35 5 25 8 30 103 2 16 25 Cash & ST Investments Receivables Inventory Current Assets-Other Current Assets-Total Net Property. Plant, & Equipment Long-Term Marketable Securities Goodwill & Intangibles Assets-Other Assets-Total 6...
According to Case 06 Exhibit 6.1, what is Company P Operating
Margin? Enter percentage, round to 2 decimal places.
Retail Airlines A B Beer C D Computers E F Hospitality G H Newspaper I J Pharmaceuticals K L Power M N Assets % O P 72 25 35 5 25 8 30 103 2 16 25 Cash & ST Investments Receivables Inventory Current Assets-Other Current Assets-Total Net Property. Plant, & Equipment Long-Term Marketable Securities Goodwill & Intangibles Assets-Other Assets-Total 6...
Consider 7075-T6 aluminum with fatigue crack growth in Table 16. Consider 7075-T6 aluminum with fatigue crack...
 Consider 7075-T6 aluminum with fatigue crack growth in
Table
16. Consider 7075-T6 aluminum with fatigue crack growth properties as given in Table 6.3. Assuming that 1=0.5 in the Walker equation, @. estimate da/dN versus AK equations in the form of Eq. 6.22a for R=0.4 and 0.8. 6. plot the equations from (a) on a log-log scale along with the R=0 equation. Keep in mind the proper region I limits of the equation. 169x10-5 ©. For a given AK, by what...
Consider 7075-T6 aluminum with fatigue crack growth in
Table
16. Consider 7075-T6 aluminum with fatigue crack growth properties as given in Table 6.3. Assuming that 1=0.5 in the Walker equation, @. estimate da/dN versus AK equations in the form of Eq. 6.22a for R=0.4 and 0.8. 6. plot the equations from (a) on a log-log scale along with the R=0 equation. Keep in mind the proper region I limits of the equation. 169x10-5 ©. For a given AK, by what...
please help. I tried stat crunch but got it wrong please show work so I know...
 please help. I tried stat crunch but got it wrong
please show work so I know what I am doing. thank you so
much
Homework. HW 5.3 Score: 0 of 1 pt 10 of 10 (8 complete) HW Score: 65%, 65 of 5.3.40 EQuestion Help A mechanic sells a brand of automobile tire that has a life expectancy that is nomally distributed, with a mean life of 28,000 miles and a standard deviation of 2700 miles He wants to give...
please help. I tried stat crunch but got it wrong
please show work so I know what I am doing. thank you so
much
Homework. HW 5.3 Score: 0 of 1 pt 10 of 10 (8 complete) HW Score: 65%, 65 of 5.3.40 EQuestion Help A mechanic sells a brand of automobile tire that has a life expectancy that is nomally distributed, with a mean life of 28,000 miles and a standard deviation of 2700 miles He wants to give...
For this project, each part will be in its oun matlab script. You will be uploading a total 3 m f...
 For this project, each part will be in its oun matlab script. You will be uploading a total 3 m files. Be sure to make your variable names descriptive, and add comments regularly to describe what your code is doing and hou your code aligns with the assignment 1 Iterative Methods: Conjugate Gradient In most software applications, row reduction is rarely used to solve a linear system Ar-b instead, an iterative algorithm like the one presented below is used. 1.1...
Data file: "STATE" "MALE" "BIRTH" "DIVO" "BEDS" "EDUC" "INCO" "LIFE" AK 119.1 24.8 5.6 603.3 14.1...
data file: "STATE" "MALE" "BIRTH" "DIVO" "BEDS" "EDUC" "INCO" "LIFE" AK 119.1 24.8 5.6 603.3 14.1 4638 69.31 AL 93.3 19.4 4.4 840.9 7.8 2892 69.05 AR 94.1 18.5 4.8 569.6 6.7 2791 70.66 AZ 96.8 21.2 7.2 536.0 12.6 3614 70.55 CA 96.8 18.2 5.7 649.5 13.4 4423 71.71 CO 97.5 18.8 4.7 717.7 14.9 3838 72.06 CT 94.2 16.7 1.9 791.6 13.7 4871 72.48 DC 86.8 20.1 3.0 1859.4 17.8 4644 65.71 DE 95.2 19.2 3.2 926.8 13.1...
EX16_XL_CH05_GRADER_CAP_AS - Travel Expenses 1.8 Project Description: <Project Description> Steps to Perform: Step Instructions Points Possible...
 EX16_XL_CH05_GRADER_CAP_AS - Travel
Expenses 1.8
Project Description:
<Project Description>
Steps to Perform:
Step
Instructions
Points Possible
1
Start Excel. Open the downloaded Excel file named
exploring_e05_grader_a1_Expenses.xlsx. Save the workbook
as exploring_e05_grader_a1_Expenses_LastFirst,
replacing LastFirstwith your own name.
0
2
On the Subtotals worksheet, use the Sort dialog box to sort the
data by Employee and further sort by Category, both in alphabetical
order.
4
3
Use the Subtotals feature to insert subtotal rows by Employee to
calculate the total expense by...
EX16_XL_CH05_GRADER_CAP_AS - Travel
Expenses 1.8
Project Description:
<Project Description>
Steps to Perform:
Step
Instructions
Points Possible
1
Start Excel. Open the downloaded Excel file named
exploring_e05_grader_a1_Expenses.xlsx. Save the workbook
as exploring_e05_grader_a1_Expenses_LastFirst,
replacing LastFirstwith your own name.
0
2
On the Subtotals worksheet, use the Sort dialog box to sort the
data by Employee and further sort by Category, both in alphabetical
order.
4
3
Use the Subtotals feature to insert subtotal rows by Employee to
calculate the total expense by...
 Homework #1-Chapter1&2&4&5 (20pts for turned in on time) 7. (14pts)Carbon Dioxide Emissions. Burning fuels in power plants or motor vehicles emits carbon dioxide (CO2), which contributes to global warming. Table below shows CO2 emissions per person from countries with populations of at least 20 million. Carbon Dioxide emissions (metric tons per person) CO2 Country Ukraine SouthAfrica Italy Poland CO2 Country Country CO2 6.3 1.6 Ethiopia 0.1 Indonesia 7 1.8 Nepal Tanzania 0.1 Brazil 7.8 2 0.1 Egypt 7.8 Congo 2.6...
 How would I make the Excel speadsheet do
these things in seperate colums?
A B 2 1 ld 21 3 M IN L Doors Lowercase Sentence 3 3 4. 3 بیب 32 بیب 7 8 بیب بیب 9 10 بیب بیب 12 بیب 13 بیب C D E F Price Age_08_04 Mfg_Year KM 13500 23 200246986 13750 23 2002 72937 13950 24 2002 41711 14950 26 2002 48000 13750 30 2002 38500 12950 2002 61000 16900 27 2002 94612 18600...
How would I make the Excel speadsheet do
these things in seperate colums?
A B 2 1 ld 21 3 M IN L Doors Lowercase Sentence 3 3 4. 3 بیب 32 بیب 7 8 بیب بیب 9 10 بیب بیب 12 بیب 13 بیب C D E F Price Age_08_04 Mfg_Year KM 13500 23 200246986 13750 23 2002 72937 13950 24 2002 41711 14950 26 2002 48000 13750 30 2002 38500 12950 2002 61000 16900 27 2002 94612 18600...
 I need to match these ten industries using Exhibit 3: For
example, Electrical Utility is #8 and Retail Grocery is #7. Please
help! Thanks. I have 7 confirmed these are:
Each of the 10 publicly traded companies in Exhibit 3 is drawn
from one of the following industries (listed below in random
order):
I have 7 confirmed these are:
1. Management consulting services
2.
3. Data processing and camera
applications services
4. Electronic, aerospace, communication, sensor
systems
5. Hospital and...
I need to match these ten industries using Exhibit 3: For
example, Electrical Utility is #8 and Retail Grocery is #7. Please
help! Thanks. I have 7 confirmed these are:
Each of the 10 publicly traded companies in Exhibit 3 is drawn
from one of the following industries (listed below in random
order):
I have 7 confirmed these are:
1. Management consulting services
2.
3. Data processing and camera
applications services
4. Electronic, aerospace, communication, sensor
systems
5. Hospital and...
 According to Case 06 Exhibit 6.1, what is Company P Operating
Margin? Enter percentage, round to 2 decimal places.
Retail Airlines A B Beer C D Computers E F Hospitality G H Newspaper I J Pharmaceuticals K L Power M N Assets % O P 72 25 35 5 25 8 30 103 2 16 25 Cash & ST Investments Receivables Inventory Current Assets-Other Current Assets-Total Net Property. Plant, & Equipment Long-Term Marketable Securities Goodwill & Intangibles Assets-Other Assets-Total 6...
According to Case 06 Exhibit 6.1, what is Company P Operating
Margin? Enter percentage, round to 2 decimal places.
Retail Airlines A B Beer C D Computers E F Hospitality G H Newspaper I J Pharmaceuticals K L Power M N Assets % O P 72 25 35 5 25 8 30 103 2 16 25 Cash & ST Investments Receivables Inventory Current Assets-Other Current Assets-Total Net Property. Plant, & Equipment Long-Term Marketable Securities Goodwill & Intangibles Assets-Other Assets-Total 6...
 Consider 7075-T6 aluminum with fatigue crack growth in
Table
16. Consider 7075-T6 aluminum with fatigue crack growth properties as given in Table 6.3. Assuming that 1=0.5 in the Walker equation, @. estimate da/dN versus AK equations in the form of Eq. 6.22a for R=0.4 and 0.8. 6. plot the equations from (a) on a log-log scale along with the R=0 equation. Keep in mind the proper region I limits of the equation. 169x10-5 ©. For a given AK, by what...
Consider 7075-T6 aluminum with fatigue crack growth in
Table
16. Consider 7075-T6 aluminum with fatigue crack growth properties as given in Table 6.3. Assuming that 1=0.5 in the Walker equation, @. estimate da/dN versus AK equations in the form of Eq. 6.22a for R=0.4 and 0.8. 6. plot the equations from (a) on a log-log scale along with the R=0 equation. Keep in mind the proper region I limits of the equation. 169x10-5 ©. For a given AK, by what...
 please help. I tried stat crunch but got it wrong
please show work so I know what I am doing. thank you so
much
Homework. HW 5.3 Score: 0 of 1 pt 10 of 10 (8 complete) HW Score: 65%, 65 of 5.3.40 EQuestion Help A mechanic sells a brand of automobile tire that has a life expectancy that is nomally distributed, with a mean life of 28,000 miles and a standard deviation of 2700 miles He wants to give...
please help. I tried stat crunch but got it wrong
please show work so I know what I am doing. thank you so
much
Homework. HW 5.3 Score: 0 of 1 pt 10 of 10 (8 complete) HW Score: 65%, 65 of 5.3.40 EQuestion Help A mechanic sells a brand of automobile tire that has a life expectancy that is nomally distributed, with a mean life of 28,000 miles and a standard deviation of 2700 miles He wants to give...
 For this project, each part will be in its oun matlab script. You will be uploading a total 3 m files. Be sure to make your variable names descriptive, and add comments regularly to describe what your code is doing and hou your code aligns with the assignment 1 Iterative Methods: Conjugate Gradient In most software applications, row reduction is rarely used to solve a linear system Ar-b instead, an iterative algorithm like the one presented below is used. 1.1...
 EX16_XL_CH05_GRADER_CAP_AS - Travel
Expenses 1.8
Project Description:
<Project Description>
Steps to Perform:
Step
Instructions
Points Possible
1
Start Excel. Open the downloaded Excel file named
exploring_e05_grader_a1_Expenses.xlsx. Save the workbook
as exploring_e05_grader_a1_Expenses_LastFirst,
replacing LastFirstwith your own name.
0
2
On the Subtotals worksheet, use the Sort dialog box to sort the
data by Employee and further sort by Category, both in alphabetical
order.
4
3
Use the Subtotals feature to insert subtotal rows by Employee to
calculate the total expense by...
EX16_XL_CH05_GRADER_CAP_AS - Travel
Expenses 1.8
Project Description:
<Project Description>
Steps to Perform:
Step
Instructions
Points Possible
1
Start Excel. Open the downloaded Excel file named
exploring_e05_grader_a1_Expenses.xlsx. Save the workbook
as exploring_e05_grader_a1_Expenses_LastFirst,
replacing LastFirstwith your own name.
0
2
On the Subtotals worksheet, use the Sort dialog box to sort the
data by Employee and further sort by Category, both in alphabetical
order.
4
3
Use the Subtotals feature to insert subtotal rows by Employee to
calculate the total expense by...
Most questions answered within 3 hours.
-
Write a program to solve the Josephus problem, with the following
modification:
Sample Input:
./a.out n...
asked 5 minutes ago -
At the start of a CD it is spinning at a rate of 525 rpm
(revolutions...
asked 41 minutes ago -
4. Without doing any calculations, predict whether the observed
∆T would increase, decrease or remain the...
asked 1 hour ago -
Based on the range, which of the following sets of scores has
the greatest variability? 3,...
asked 3 hours ago -
Ripples in a pond travel at a velocity of 3 m/s with one peak
passing a...
asked 2 hours ago -
A man stands on the roof of a building of height 13.0 mm and
throws a...
asked 2 hours ago -
The extent to which assets are financed by borrowed funds and
other liabilities is indicated by:...
asked 4 hours ago -
Explain in detail
Germany is the fifth largest economy
explain what goods and services Germany specializes...
asked 4 hours ago -
The density of platinum is 21.45 g/mL. If a cube of platinum
with a mass of...
asked 4 hours ago -
Accounts Receivable
Sales
A/R Posting
Extended Sales Invoice
Packing Slip
Compare invoice to packing slip 2...
asked 4 hours ago -
Michaella, age 23, is a full-time law student and is claimed by
her parents as a...
asked 4 hours ago -
Why are polymers not typically casted into products?
asked 4 hours ago