HELLO, PLEASE HELP WITH QUESTIONS 8-10 PLEASE PLEASE AND THANK YOU!!


PLEASE, I DON'T HAVE ANY MORE QUESTIONS, AND I ASKED THIS 2 TIMES ALREADY AND NO RESPONSE. THANK YOU!!! APPRECIATE IT!!
Homework Answers
Answer 8:
Given:
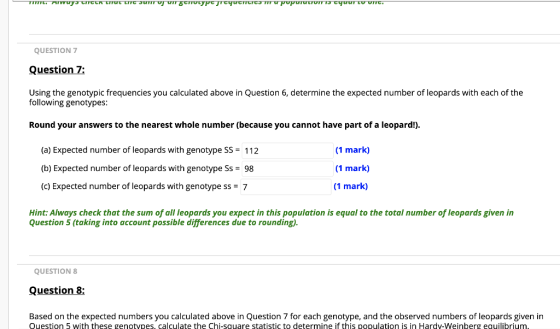
There are 112 SS, 98 Ss and 7 ss type individuals.
Thus, total population size
= (112+98+7)
=217
The allelic frequencies of allele S and s be p and q respectively.
Frequency of an allele = (Number of that allele in the population) /(Population size × 2)
Frequency of S allele
= { (112×2) + (98) }/(217×2)
=0.742
Thus, frequency of allele "s"
= (1-0.742)
0.258
Expected number of individuals of each genotype :
Number of SS individuals:
= p^2 × population size
= (0.742×0.742×217)
=120
Number of Ss individuals:
=2pq × population size
= 2×0.742×0.258×217
=83
Number of ss individuals:
= q^2 × population size
=(0.258×0.258×217)
=14
| Genotype | Observed Frequency (O) | Expected frequency (E) | (O-E)2/E |
| SS | 112 | 120 | 0.533 |
| Ss | 98 | 83 | 2.710 |
| ss | 7 | 14 | 3.5 |
The value of chi square is:

= (0.533 + 2.71 + 3.5)
=6.743
Answer 9:
Here, number of expected genotypes is 3 (SS, Ss, ss) and there are two alleles (S and s).
Thus, degrees of freedom,
=2-1
=1
Answer 10:
Chi square value of 6.733 lies between the between the values 0.01 and 0.005 at one degrees of freedom (from the chi square table).
Hence, the correct choice should be:
0.01>P>0.005
Add Answer to:
HELLO, PLEASE HELP WITH QUESTIONS 8-10 PLEASE PLEASE AND THANK
YOU!!
PLEASE, I DON'T HAVE ANY...
In recent years, some leopard populations have suffered from aloss of habitat. You are part...
In recent years, some leopard populations have suffered from a loss of habitat. You are part of a research team that is studying the effects that decreased range has on these populations. Your team observed that a portion of one population relocated to the desert and merged with another small leopard population after its own habitat was threatened by deforestation. You have been assigned to lead the study of this new population and look at its gene pool make-up. In...
Considering the above information, how would you go about completing the following question? Phenotype brown pigmentation...
 Considering the above information, how would you go about
completing the following question?
Phenotype brown pigmentation brown pigmentation red pigmentation (strawberry leopard) Genotype SS ss Number of leopards 112 98 SS Note: S = dominant allele for brown pigmentation s = recessive allele for red pigmentation (erythrism) Over the next several questions, we will work our way through the process to determine if this leopard population is in Hardy-Weinberg equilibrium (this will include applying the Chi-square goodness-of-fit test). (Before beginning...
Considering the above information, how would you go about
completing the following question?
Phenotype brown pigmentation brown pigmentation red pigmentation (strawberry leopard) Genotype SS ss Number of leopards 112 98 SS Note: S = dominant allele for brown pigmentation s = recessive allele for red pigmentation (erythrism) Over the next several questions, we will work our way through the process to determine if this leopard population is in Hardy-Weinberg equilibrium (this will include applying the Chi-square goodness-of-fit test). (Before beginning...
Hello, please please please answer these questions! I would appreciate it!!! Thank you soooo much!!!! Questions...
 Hello, please please please answer these questions! I would
appreciate it!!!
Thank you soooo much!!!!
Questions 2 to 4 are based on the following scenario Question 2: Although the following scenario is hypothetical, it is based on actual facts. Pukaha National Wildlife Centre is a captive breeding facility located in a protected forest area in the lower part of the North Island of Aotearoa, New Zealand. It aims to restore native wildlife, with its initial target on birds. One of...
Hello, please please please answer these questions! I would
appreciate it!!!
Thank you soooo much!!!!
Questions 2 to 4 are based on the following scenario Question 2: Although the following scenario is hypothetical, it is based on actual facts. Pukaha National Wildlife Centre is a captive breeding facility located in a protected forest area in the lower part of the North Island of Aotearoa, New Zealand. It aims to restore native wildlife, with its initial target on birds. One of...
Hi fellow tutor, Please note that from part A-J have been answered. I would like some...
Hi fellow tutor, Please note that from part A-J have been answered. I would like some help please with parts K-N. Thank you Question 5: Applying Mathematical Analysis to Evolutionary Change (17 points) Coloration patterns of a species of snake are controlled by a single gene with two alleles (A= dominant, a=recessive). One population of snakes living in North Carolina was sampled and analyzed using RFLP analysis (restriction fragment length polymorphism), a technique that cuts DNA in specific regions that...
The following genotypes were observed in a population: Genotype: JJ (40), Jj (45), jj (50) a....
The following genotypes were observed in a population: Genotype: JJ (40), Jj (45), jj (50) a. Calculate the observed genotypic and allelic frequencies for this population. b. Calculate the expected numbers of individuals for each genotype if this population were in Hardy- Weinberg equilibrium. c. Using a chi-square test, determine whether the population is in Hardy-Weinberg equilibrium.
Assume you have a population of stinkbug larvae scored for their genotypes at the PGI-2 allozyme...
Assume you have a population of stinkbug larvae scored for their genotypes at the PGI-2 allozyme locus: PGI-2a/PGI-2a: 125 individuals PGI-2a/PGI-2b: 250 individuals PGI-2b/PGI-2b: 125 individuals Now assume that only 70% of the heterozygotes survive to adulthood and become stinkbugs. a) Calculate the observed genotype and allele frequencies for the initial larvae. b) Calculate the expected Hardy-Weinberg genotypic frequencies for the larvae. Are the larvae in Hardy-Weinberg equilibrium? c) What are the genotypic and allele frequencies among adults in the...
For a particular gene associated with a degenerative neurological disorder, you surveyed genotype frequencies in a...
For a particular gene associated with a degenerative neurological disorder, you surveyed genotype frequencies in a population and found that 16 people had genotype AA, 97 had genotype Aa, 15 had genotype aa. a) Calculate the allele frequencies. b) Calculate the expected genotype frequencies under Hardy-Weinberg Equilibrium. Use the chi-square test to determine whether the observed number of people with different genotypes and expected number of people with different genotypes are significantly different (at an alpha level of 0.05). What...
Chi square problem need help please show work of how they solved for the chi square...
 Chi square problem need help please show work of how they
solved for the chi square value, the correct answer is in
red.
**On this page and the next two, report all* calculated non-integer values to the nearest 0.01** 18. x2. As you learned in one or more of your introductory biology courses, the frequencies of the genotypes in a population at "Hardy-Weinberg" equilibrium can be predicted from the frequencies of the individual alleles "A" and "a' at the locus...
Chi square problem need help please show work of how they
solved for the chi square value, the correct answer is in
red.
**On this page and the next two, report all* calculated non-integer values to the nearest 0.01** 18. x2. As you learned in one or more of your introductory biology courses, the frequencies of the genotypes in a population at "Hardy-Weinberg" equilibrium can be predicted from the frequencies of the individual alleles "A" and "a' at the locus...
I've tried 0.16, 0.48, 0.36 and 32, 96, 72 I have 2 trials left, please help....
 I've tried 0.16, 0.48, 0.36
and 32, 96, 72
I have 2 trials left, please help.
Here's a hint: Hint 2. How to calculate the
expected frequencies of a different example population Consider an
example population of individuals that have two alleles for a
specific locus, AB and AC. In the population, 70% (0.7) of the
alleles are AB, and 30% (0.3) of the alleles are AC. The expected
frequencies of each genotype can be calculated using the equation
for...
I've tried 0.16, 0.48, 0.36
and 32, 96, 72
I have 2 trials left, please help.
Here's a hint: Hint 2. How to calculate the
expected frequencies of a different example population Consider an
example population of individuals that have two alleles for a
specific locus, AB and AC. In the population, 70% (0.7) of the
alleles are AB, and 30% (0.3) of the alleles are AC. The expected
frequencies of each genotype can be calculated using the equation
for...
Previous Page Next Page Page Question 9 (1 point) Question 1: A population has the following...
 Previous Page Next Page Page Question 9 (1 point) Question 1: A population has the following data: Genotype Number AA o aa Do a Chi-square test to determine if the population is at Hardy-Weinberg equilibrium. What is your hypothesis? The population is at HW equilibrium and have the expected HW genotype frequencies. The population is not at HW equilibrium and not have the expected HW genotype frequencies. The population can never reach HW equilibrium. The population is not at HW...
 Considering the above information, how would you go about
completing the following question?
Phenotype brown pigmentation brown pigmentation red pigmentation (strawberry leopard) Genotype SS ss Number of leopards 112 98 SS Note: S = dominant allele for brown pigmentation s = recessive allele for red pigmentation (erythrism) Over the next several questions, we will work our way through the process to determine if this leopard population is in Hardy-Weinberg equilibrium (this will include applying the Chi-square goodness-of-fit test). (Before beginning...
Considering the above information, how would you go about
completing the following question?
Phenotype brown pigmentation brown pigmentation red pigmentation (strawberry leopard) Genotype SS ss Number of leopards 112 98 SS Note: S = dominant allele for brown pigmentation s = recessive allele for red pigmentation (erythrism) Over the next several questions, we will work our way through the process to determine if this leopard population is in Hardy-Weinberg equilibrium (this will include applying the Chi-square goodness-of-fit test). (Before beginning...
 Hello, please please please answer these questions! I would
appreciate it!!!
Thank you soooo much!!!!
Questions 2 to 4 are based on the following scenario Question 2: Although the following scenario is hypothetical, it is based on actual facts. Pukaha National Wildlife Centre is a captive breeding facility located in a protected forest area in the lower part of the North Island of Aotearoa, New Zealand. It aims to restore native wildlife, with its initial target on birds. One of...
Hello, please please please answer these questions! I would
appreciate it!!!
Thank you soooo much!!!!
Questions 2 to 4 are based on the following scenario Question 2: Although the following scenario is hypothetical, it is based on actual facts. Pukaha National Wildlife Centre is a captive breeding facility located in a protected forest area in the lower part of the North Island of Aotearoa, New Zealand. It aims to restore native wildlife, with its initial target on birds. One of...
 Chi square problem need help please show work of how they
solved for the chi square value, the correct answer is in
red.
**On this page and the next two, report all* calculated non-integer values to the nearest 0.01** 18. x2. As you learned in one or more of your introductory biology courses, the frequencies of the genotypes in a population at "Hardy-Weinberg" equilibrium can be predicted from the frequencies of the individual alleles "A" and "a' at the locus...
Chi square problem need help please show work of how they
solved for the chi square value, the correct answer is in
red.
**On this page and the next two, report all* calculated non-integer values to the nearest 0.01** 18. x2. As you learned in one or more of your introductory biology courses, the frequencies of the genotypes in a population at "Hardy-Weinberg" equilibrium can be predicted from the frequencies of the individual alleles "A" and "a' at the locus...
 I've tried 0.16, 0.48, 0.36
and 32, 96, 72
I have 2 trials left, please help.
Here's a hint: Hint 2. How to calculate the
expected frequencies of a different example population Consider an
example population of individuals that have two alleles for a
specific locus, AB and AC. In the population, 70% (0.7) of the
alleles are AB, and 30% (0.3) of the alleles are AC. The expected
frequencies of each genotype can be calculated using the equation
for...
I've tried 0.16, 0.48, 0.36
and 32, 96, 72
I have 2 trials left, please help.
Here's a hint: Hint 2. How to calculate the
expected frequencies of a different example population Consider an
example population of individuals that have two alleles for a
specific locus, AB and AC. In the population, 70% (0.7) of the
alleles are AB, and 30% (0.3) of the alleles are AC. The expected
frequencies of each genotype can be calculated using the equation
for...
 Previous Page Next Page Page Question 9 (1 point) Question 1: A population has the following data: Genotype Number AA o aa Do a Chi-square test to determine if the population is at Hardy-Weinberg equilibrium. What is your hypothesis? The population is at HW equilibrium and have the expected HW genotype frequencies. The population is not at HW equilibrium and not have the expected HW genotype frequencies. The population can never reach HW equilibrium. The population is not at HW...
Most questions answered within 3 hours.
-
Write a Haskell function integerSqrt that returns the integer
square root of a positive integer n....
asked 2 minutes ago -
Because it can go from rest to 13.5 m/s (about 30 mi/h) in 2.0
s, one...
asked 8 minutes ago -
You would like to estimate the weighted average cost of capital
for a new airline business....
asked 13 minutes ago -
At 571 mm Hg and 323 K, a gas sample has a volume of 2.45 mL....
asked 14 minutes ago -
What would happen to the US Economy's Inflation Rate (%) if the
Individual Tax Rate for...
asked 14 minutes ago -
A
50-N crate sits on a horizontal floor where the coefficient of
static friction between the...
asked 16 minutes ago -
1. Why is it dangerous to extrapolate outside the experimental
region? 2. Discuss how the least...
asked 47 minutes ago -
Timber Tour has a current ratio of 1.5 and a quick ratio of 0.8.
Given this,...
asked 32 minutes ago -
Which error is Christine trying to correct when she says: “I
know one chart isn’t going...
asked 32 minutes ago -
c++
#include
using namespace std;
int main()
{
int n, x, num, j = 0;...
asked 33 minutes ago -
Hi
i need a research about any subject related to one of these
subject:
energy methods...
asked 46 minutes ago -
To develop a client/server application using TCP sockets and the
C programming language that is capable...
asked 44 minutes ago